Equities · Reading 47
Industry and Competitive Analysis
CFA Level I · Equities · Reading 47 · about 43 min
What you'll learn
- LOS 47.a Describe the five steps of industry and competitive analysis: define, survey, analyze structure, examine external influences, analyze competitive strategies.
- LOS 47.b Describe commercial classification systems (GICS, ICB, TRBC) and their limitations, and grouping by geography and business cycle sensitivity (defensive, cyclical, growth).
- LOS 47.c Estimate industry size (top-down vs. bottom-up), judge growth, measure profitability (operating margin, ROIC) and market share and concentration (HHI).
- LOS 47.d Analyze industry structure with Porter's five forces and external influences with PESTLE, including the innovation matrix.
Module 47.1
Industry Analysis Framework
This reading sets out the five steps of industry and competitive analysis and the ways companies are grouped into industries. It shows how to survey an industry's size, growth, profitability (operating margin and ROIC) and concentration (market share and the HHI), and how to analyze industry structure with Porter's five forces and external influences with PESTLE and the innovation matrix.
LOS 47.a — The five steps of industry and competitive analysis
Industry and competitive analysis studies the environment a company operates in. For this purpose an industry is a group of firms offering comparable products or services. Understanding what drives an industry's size and profits lets the analyst justify the inputs of a valuation model and explain the narrative behind them. Being able to do so also helps show that a recommendation has a reasonable basis.
Key concept
| Step | What the analyst does | Typical content |
|---|---|---|
| 1. Define the industry | Set the scope of the industry | Which products and which geographic regions belong; how to treat companies active in several industries; third-party classification systems |
| 2. Survey the industry | Measure the industry | Size, historical growth and growth drivers, profitability, main participants and market share trends |
| 3. Analyze the industry structure | Judge how competitive the industry is | Porter's five forces, giving the degree of competitive rivalry and the key drivers of profitability |
| 4. Examine external influences | Look at forces outside the industry | PESTLE framework: political, economic, social, technological, legal, environmental |
| 5. Analyze competitive strategies | Look at each company in the industry | How each firm positions itself and what competitive advantages it has |
Common exam traps
- PESTLE belongs to step 4 (external influences); Porter's five forces belongs to step 3 (industry structure).
- Deciding which regions or products fall inside the industry is part of defining it. Measuring past growth rates is part of surveying it.
- Reviewing a company's financial statements and estimating its intrinsic value are company analysis and valuation tasks. They are not among the five steps.
LOS 47.b — Grouping companies into industries
Defining the industry comes first. Firms in one industry face the same competitive forces and value drivers, so the classification tells the analyst where to find comparable companies.
Commercial (third-party) classification systems
Global providers classify companies by the products and services they offer (their principal business activity) into hierarchical taxonomies. The company sits in the lowest tier; higher tiers aggregate groups.
| System | Developer | Coverage | Tiers (broad → narrow) |
|---|---|---|---|
| Global Industry Classification Standard (GICS) | S&P Dow Jones Indices and MSCI | Public companies | Sector → industry group → industry → subindustry |
| Industry Classification Benchmark (ICB) | FTSE Russell | Public companies | Industry → supersector → sector → subsector |
| The Refinitiv Business Classification (TRBC) | Refinitiv | Public and private companies, not-for-profits, government entities | Economic sector → business sector → industry group → industry → activity |
Regional systems include NAICS (North America) and NACE (Europe). Providers review classifications at least once a year. Data vendors (Bloomberg, FactSet, S&P Capital IQ and others) and exchanges such as Nasdaq either adopt one of these systems or build a similar taxonomy of their own.
The main advantage of a commercial system is consistency. Its groups can still be too broad or too narrow, so the analyst has to apply judgment. Specific limitations:
- groups may contain companies with different business models or with substitute products;
- a company operating in several industries is often placed according to the product that brings in the most revenue, which can hide a significant other business, and the systems do not all follow the same rules, so the same company can land in different groups;
- industries that serve only local or national markets (e.g., insurance, health care) do not fit global taxonomies well;
- groupings change over time through reclassifications, new entrants and delistings, so historical data may need restating.
Other ways to group companies
- Geography, usually the country of domicile or listing (developed, emerging, frontier). It may not match where the revenue is earned or where the assets are.
- Business cycle sensitivity:
Key concept
| Type | Demand / earnings pattern | Typical sectors |
|---|---|---|
| Defensive | Relatively stable demand through expansions and contractions | Health care, utilities, telecommunications, consumer staples |
| Cyclical | Earnings depend heavily on the stage of the business cycle; volatile earnings, usually high operating leverage | Basic materials, consumer discretionary, energy, financial services, industrials and producer durables |
| Growth | Strong revenue growth through all phases of the cycle; may or may not be profitable yet, depending on its life-cycle phase | Emerging technology, biotechnology |
Cyclical products tend to have long lives or high unit values, so purchases can be postponed until the economy improves (cars, appliances, equipment). Cyclical firms also buy inputs, such as commodities, whose demand moves with the cycle, and the combination of swinging revenue and high fixed costs makes their operating profit volatile. For a growth company the analyst estimates how long above-trend growth can last and what profit levels will look like once growth levels off. Geography and cycle sensitivity can be combined when countries are at different points in their cycles.
Common exam traps
- Commercial systems group companies by products and services. Geography and business cycle sensitivity are other ways analysts can group companies.
- "Cyclical versus defensive" describes how sensitive earnings and demand are to the business cycle. Stock price volatility is a different matter.
- A growth company's revenue growth is largely independent of the cycle, which distinguishes it from a cyclical company in an expansion.
LOS 47.c — Surveying the industry: size, growth, profitability, market share
Industry size
Industry size means one year's total sales of the product or service being analyzed. It can differ from the total sales of the companies in the industry. For a multi-product company, only the relevant part of its sales counts.
| Approach | How it works | Advantage | Limitations |
|---|---|---|---|
| Top-down approach | Estimates total industry revenue from government agency or third-party data | Works for industries with many private or small firms that do not publish results | Data may not be granular enough for niche analysis |
| Bottom-up approach | Adds up the revenues of each company that produces the good or service | Direct and precise when large listed companies dominate | Hard to isolate revenue of multi-product companies; inconsistent segment reporting; poor fit when many firms are private |
Growth
Compare industry growth with the economy (life-cycle stage) and across the business cycle (sensitivity).
- Growth industries typically grow faster than the economy whatever the phase of the cycle, because they have not yet reached their total addressable market. Estimating when their growth will peak is harder when it rests on an emerging technology.
- Mature industries have little or no growth potential left. All industries together grow at the economy's rate, so mature industries grow near or below that rate. Analysts watch for disruptors and signs of decline.
- Industries sensitive to interest rates, discretionary spending or capital goods have more volatile revenue over the cycle; structural shocks (e.g., the pandemic) can also shift demand.
Profitability
where NOPAT = net operating profit after taxes and average invested capital = average of long-term liabilities plus equity over the period. Return on invested capital (ROIC) reflects returns to all capital providers and is compared with the weighted average cost of capital (WACC). ROIC above WACC means value is being created. For private companies, analysts use listed peers' returns or government/third-party data.
Example. NOPAT million and average invested capital million give ROIC , above a 9% WACC.
Market share and concentration
Because industry size is hard to pin down, market share is best expressed as a range. Rising share suggests customers favor the firm's products, and a trend of falling shares among incumbents can reveal competition from new entrants. Consolidation can lift a company's share, so the analyst checks share net of acquisitions.
The Herfindahl-Hirschman Index (HHI) is the sum of the squared market shares (in percent) of all participants:
Key concept
Example. Shares of 40%, 30%, 20% and 10% give . The maximum is (a monopoly). An HHI above 1,800 is often read as high concentration. Unless the industry is segmented or highly differentiated, higher concentration means less competition, so firms tend to have more pricing power and higher profitability.
Common exam traps
- Square the shares in percent (e.g., ); using decimals gives a number between 0 and 1. In the example, decimal shares give 0.30 instead of 3,000.
- The top-down approach suits many-private-firm industries; its weakness is lack of granularity. The bottom-up approach sums company revenues; its weakness is separating multi-product revenue.
- ROIC uses after-tax operating profit over average invested capital (long-term liabilities plus equity). It measures the return to all capital providers, which ROE and gross margin do not.
Bottom line
- Industry and competitive analysis has five steps: define the industry, survey it, analyze its structure with Porter's five forces, examine external influences with PESTLE, and analyze the competitive strategies of its companies.
- Commercial classification systems such as GICS, ICB and TRBC group companies by the products and services they offer into hierarchical tiers; they are consistent, but groups can be too broad or too narrow, and a company in several industries is often placed by the product that earns the most revenue.
- Defensive industries have relatively stable demand through expansions and contractions, cyclical industries have earnings that depend heavily on the stage of the cycle and usually high operating leverage, and growth industries grow revenue strongly through all phases of the cycle.
- Industry size is one year's total sales of the product or service; the top-down approach uses government or third-party data and suits industries with many private or small firms, while the bottom-up approach adds up company revenues and works best when large listed companies dominate.
- ROIC is NOPAT divided by average invested capital (long-term liabilities plus equity), a return to all capital providers, and ROIC above WACC means value is being created.
- The HHI is the sum of squared market shares in percent, with a maximum of 10,000 and a reading above 1,800 often taken as high concentration; unless the industry is segmented or highly differentiated, higher concentration means less competition and more pricing power.
Quick check
Kalinda Osei is studying how carbon-pricing rules, changing attitudes toward home exercise, and higher interest rates could affect the fitness-equipment industry. She organizes these factors using the PESTLE framework. In the industry and competitive analysis process, this work is best described as:
Show answer and explanation
Correct answer: A
The PESTLE framework groups the political, economic, social, technological, legal and environmental factors that act on an industry from outside. Using it is the fourth step of industry and competitive analysis: examining external influences.
Why the other options are wrong
- B. Analyzing the industry structure (step 3) uses a framework such as Porter's five forces to judge competitive rivalry and profitability drivers. PESTLE belongs to a later step.
- C. Defining the industry (step 1) sets its scope: which products, regions and companies belong in it.
Key takeaway Porter's five forces serve step 3 (industry structure); PESTLE serves step 4 (external influences).
Module 47.2
Porter's Five Forces and PESTLE Analysis
LOS 47.d — Industry structure (Porter's five forces) and external influences (PESTLE)
Porter's five forces
The two frameworks of this LOS fit together. The five forces describe the industry's structure: the pressures from rivals, would-be entrants, substitutes, suppliers and customers. PESTLE collects the influences that act on the whole industry from outside.
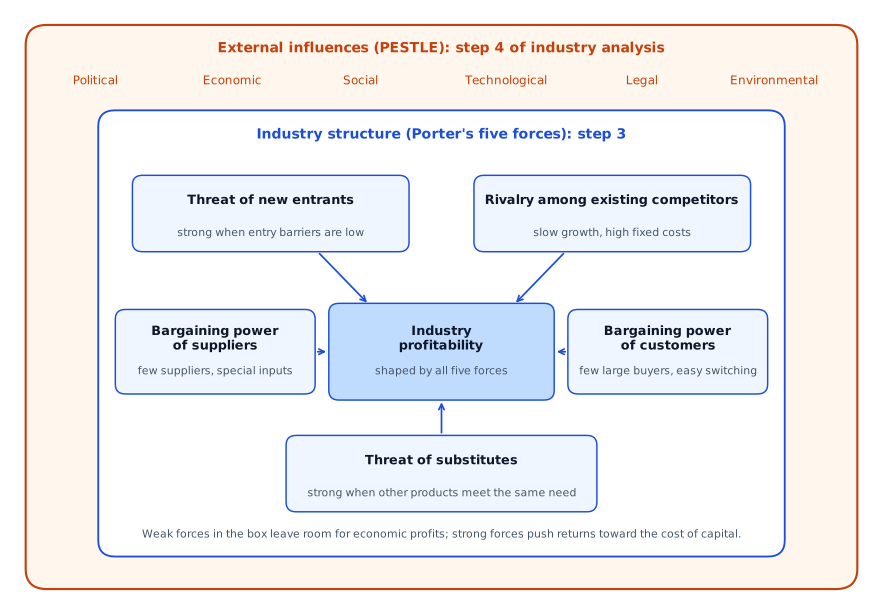
Michael Porter's framework explains the competitive forces that determine an industry's long-run profitability. When the forces are strong, industry returns on capital are unlikely to exceed the cost of capital. An economic moat is a durable competitive advantage that protects profits from competitors. Its sources include cost advantages, efficient scale, proprietary intangible assets, network effects and high switching costs. The longer the advantage lasts, the wider the moat and the longer profits stay above the cost of capital. Where only a handful of firms compete (an oligopoly, for example), wide moats are typical. Where competition is intense, few firms have one, and most earn less than their cost of capital.
Key concept
| Force | Stronger (worse for industry profits) when… |
|---|---|
| Threat of new entrants | Barriers to entry are low: little capital needed, no scale advantages, no licensing or patent protection, weak customer loyalty, low switching costs |
| Threat of substitutes | Products from other industries meet the same need; this raises the elasticity of demand and caps prices. Differentiated products with high switching costs face a low threat |
| Bargaining power of suppliers | Few suppliers, scarce or customized inputs, high switching costs, proprietary technology or organized/licensed labor. Weak when many small suppliers sell commodity inputs |
| Bargaining power of customers | Buyers are large and concentrated, products are commodity-like, switching costs are low |
| Rivalry among existing competitors | Slow growth, high fixed costs (firms cut prices to run at full capacity), difficulty exiting or cutting capacity, low concentration (many similar-sized firms), little differentiation |
When judging the threat of entry, the analyst looks at both how many firms have entered over time and how much they affected the industry. Ways incumbents defend themselves: partnering with or acquiring entrants, lobbying for protective regulation, subsidies or restrictive licensing, patents, building customer loyalty, raising switching costs (price, opportunity cost, transition risk and lost upgrades from the current provider), network effects, and cost advantages from scale or economies of scope (producing a combination of goods and services costs less than producing each separately). In mature industries selling commoditized products with inelastic demand, firms must operate at efficient scale; because a newcomer would push returns below the cost of capital, that scale requirement itself deters entry. To counter supplier or customer power, a firm may pursue vertical integration, either backward integration (upstream, toward suppliers) or forward integration (downstream, toward customers). It may also use joint ventures or exclusive supply agreements, or cut out intermediaries. Against strong customers, firms reward loyalty, bundle services or differentiate their products.
Economic profits are most likely when all the forces are weak: high barriers to entry, few substitutes, weak supplier and customer power, and mild rivalry.
Example. A regional cement industry has high entry barriers (plants are costly, transport limits imports), few substitutes, and powerful energy suppliers; rivalry is intense in downturns because plants have high fixed costs and are hard to close. Profits are therefore strongly cyclical despite the entry barriers.
PESTLE — external influences
Key concept
| Influence | Examples |
|---|---|
| Political | Taxes, subsidies, reimbursements; indirect channels (changes in monetary policy, regulation, geopolitics); direct channels (government purchases). Energy, health care and defense are highly exposed |
| Economic | Cyclical trends in output; structural factors (competitiveness, stage of development); exchange rates (a weaker currency helps exporters, a stronger one makes imports cheaper). Industry forecasts should be consistent with the economic forecast, adjusted for the industry's position in the cycle |
| Social | How people work, spend and live, which matters most for industries selling to individuals; shift to branded goods as incomes rise; demand for ethical sourcing |
| Technological | New products that make old ones redundant; drives total factor productivity |
| Legal | New laws and regulations creating risks (e.g., tobacco restrictions) or opportunities (newly legalized products) |
| Environmental | Climate change and sustainability, often linked to political, social and legal influences; the energy transition, a government-driven structural shift toward lower greenhouse gas emissions through policy, taxes and subsidies |
The innovation matrix
Innovations are classified by their domain (the products, segments or processes affected) and the problem they solve:
Key concept
| Indistinct domain | Distinct domain | |
|---|---|---|
| Distinct problem | Breakthrough innovation — a new product, service or business model with a large impact across many industries (e.g., a new battery technology) | Sustaining innovation — improves existing products for existing customers (feature enhancements) |
| Indistinct problem | Basic research — deepens scientific understanding with no specific commercial objective | Disruptive innovation — creates new markets or redefines existing ones (e.g., streaming replacing cable) |
When a market is disrupted, incumbents either change their business model or lose market share.
Common exam traps
- The five forces are rivalry among existing competitors, the threat of new entrants, the threat of substitutes, and the bargaining power of suppliers and of customers. "Power of regulators" and "rivalry among suppliers" are distractors; regulation is a PESTLE item.
- Specialized inputs give suppliers power; concentrated buyers give customers power.
- Monetary policy and regulation are indirect political influences in PESTLE.
- Sustaining innovation is a better version of an existing product. Breakthrough innovation (distinct problem, indistinct domain) has a large impact across many industries. Disruptive innovation (indistinct problem, distinct domain) creates new markets or redefines existing ones within its domain.
Bottom line
- Porter's five forces are the threat of new entrants, the threat of substitutes, the bargaining power of suppliers, the bargaining power of customers and rivalry among existing competitors; when they are strong, industry returns on capital are unlikely to exceed the cost of capital.
- An economic moat is a durable competitive advantage, from sources such as cost advantages, efficient scale, proprietary intangible assets, network effects and high switching costs, and the longer it lasts the longer profits stay above the cost of capital.
- The threat of entry is stronger when barriers are low, and rivalry is stronger with slow growth, high fixed costs, difficulty exiting, many similar-sized firms and little differentiation.
- Suppliers have power when they are few, when inputs are scarce or customized, or when they hold proprietary technology, customers have power when they are large and concentrated and products are commodity-like, and firms may respond with backward or forward vertical integration.
- PESTLE covers political, economic, social, technological, legal and environmental influences on an industry, and monetary policy and regulation are indirect political channels.
- In the innovation matrix, breakthrough innovation solves a distinct problem in an indistinct domain, sustaining innovation a distinct problem in a distinct domain, disruptive innovation an indistinct problem in a distinct domain, and basic research has no specific commercial objective.
Quick check
Fennick Labs is exploring home diagnostics within the clearly defined medical-testing domain. The exact customer problem is not yet distinct, but its new testing model could create a new market or redefine the existing diagnostics market. This strategy is most characteristic of:
Show answer and explanation
Correct answer: A
Disruptive innovation addresses an indistinct problem within a distinct domain and creates a new market or redefines an existing one. The domain here is medical testing, the exact problem is not yet distinct, and the model could reshape that market.
Why the other options are wrong
- B. Breakthrough innovation addresses a distinct problem across an indistinct domain and can affect many industries. This scenario stays within the distinct domain of medical testing.
- C. Sustaining innovation addresses a distinct problem within a distinct domain and improves existing products without redefining the market. Here the problem is indistinct and the market could be redefined.
Key takeaway Disruptive innovation = indistinct problem, distinct domain, and creation or redefinition of a market.
Practice Questions
Rosalind Achebe wants to size the market for gluten-free infant cereal. She plans to use a national statistics agency's revenue figures for the packaged-food industry. The main drawback of this approach is most likely that:
Show answer and explanation
Correct answer: B
Using government or third-party data is the top-down approach. Its key limitation is that such data may lack the granularity or specific detail needed for niche analysis. Aggregate packaged-food revenue will not isolate a narrow segment such as gluten-free infant cereal.
Why the other options are wrong
- A. Industries with many private firms are where the top-down approach works best; being a poor fit for them is a limitation of the bottom-up approach, because private firms do not publish revenues.
- C. Difficulty isolating the revenue of multi-product companies is a limitation of the bottom-up approach, which adds up company revenues.
Key takeaway Top-down: good for industries of private/small firms, weak on granularity. Bottom-up: precise when large listed firms dominate, weak with multi-product or private firms.
The residential elevator industry in a country has five manufacturers with market shares of 50%, 20%, 15%, 10% and 5%. Based on its Herfindahl-Hirschman Index (HHI), the industry's concentration is best described as:
Show answer and explanation
Correct answer: C
The HHI is the sum of the squared market shares (in percent) of all participants. Here it is 3,250, well above the 1,800 level that is often interpreted as indicating high concentration.
Since , the industry is highly concentrated.
Why the other options are wrong
- A. Low concentration would require many firms with small shares. Squaring the shares as decimals gives 0.325, which looks tiny but is simply the HHI divided by 10,000. It does not indicate low concentration.
- B. An HHI above 1,800 is often interpreted as high concentration, and at 3,250 the index is far above that level. Even the three largest firms alone give , so the industry cannot be described as only moderately concentrated.
Key takeaway Square each share in percent and add. The maximum HHI is 10,000 (monopoly); an HHI above 1,800 is often interpreted as high concentration.
This reading has 34 questions in the full bank. Practice all of them.
Key Takeaways
- Porter's five forces serve step 3 (industry structure); PESTLE serves step 4 (external influences).
- Top-down: good for industries of private/small firms, weak on granularity. Bottom-up: precise when large listed firms dominate, weak with multi-product or private firms.
- Square each share in percent and add. The maximum HHI is 10,000 (monopoly); an HHI above 1,800 is often interpreted as high concentration.
- Disruptive innovation = indistinct problem, distinct domain, and creation or redefinition of a market.