Equities · Reading 50
The Capital Asset Pricing Model, Market Model, and Other Factor-Based Equity Models
CFA Level I · Equities · Reading 50 · about 34 min
What you'll learn
- LOS 50.a Explain how the CAPM, the market model, adjusted and comparables-based betas, market risk premium estimates and country risk premiums are used to estimate a company's required return on equity.
- LOS 50.b Describe arbitrage pricing theory and multifactor models such as the four-factor model, and interpret factor betas.
Module 50.1
Estimating the Cost of Equity With the Market Model and CAPM
This reading shows how to estimate the required return on equity with the CAPM: estimating and adjusting beta, unlevering and relevering a peer beta, estimating the market risk premium and adding a country risk premium. It then covers arbitrage pricing theory and the four-factor model, including how to calculate an expected return from factor betas and premiums and how to read their signs.
LOS 50.a — Estimating the required return on equity with the CAPM and the market model
The required rate of return (cost of equity) is the discount rate in equity valuation models, so it must reflect the risk of the investment.
CAPM and the security market line
The capital asset pricing model (CAPM) is a single-factor model. Only systematic risk (beta) is priced:
Key concept
is the market risk premium (MRP). Plotted against beta, the CAPM is the security market line (SML). Its intercept is the risk-free rate and its slope is the market risk premium. The SML shifts over time as the risk-free rate and return expectations change.
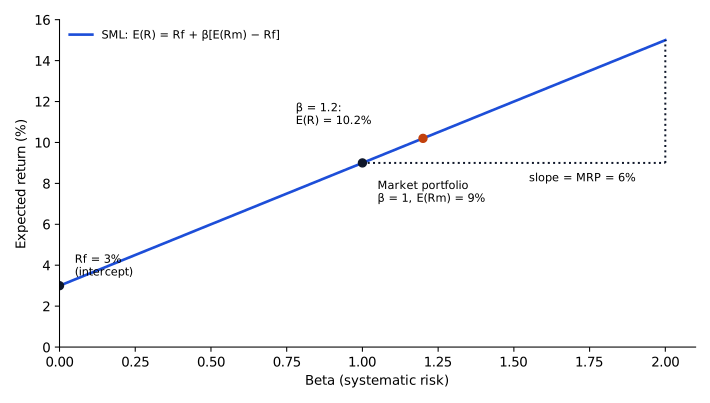
Beta can be computed from correlation and volatilities: . Example. With , and , beta is 1.20. If and , then .
Estimating beta: excess-return regression and market model
Beta is estimated by regressing the stock's returns on a market proxy (e.g., a broad index) over a lookback period (e.g., five years of monthly data):
- Excess-return form:
- Market model (actual returns): , which gives similar beta estimates.
Reading the output: the standard error of beta measures statistical noise, and a higher standard error means a less reliable estimate. measures explanatory power. Exam convention: is described as the stock–index correlation. Current practice: gives the correlation’s magnitude; the sign follows beta (positive beta: positive correlation; negative beta: negative correlation).
The length of the lookback period involves a trade-off. A longer sample lowers the standard error. If it reaches back to a time when the company's business or capital structure was different, however, the beta describes a risk profile that no longer applies.
Adjusted beta (mean reversion)
Beta is estimated from past data, but the cost of equity it produces is used to discount future cash flows. Market model betas tend to revert toward 1.0. An adjusted beta is a weighted average of the raw beta and 1.0:
Example. A raw beta of 1.45 gives . A raw beta above 1 is adjusted down, and a raw beta below 1 is adjusted up. With the common fixed weight of 2/3, the adjustment does not depend on the length of the lookback period.
Beta from comparables (pure-play approach)
For private companies (no price history) or firms whose capital structure has changed significantly, analysts use peer betas. Estimating beta for an equally weighted portfolio of peers also reduces statistical noise and captures the industry's business risk. A company's beta reflects both business risk and financial risk, so it is a levered beta. Remove the peers' leverage, then add back the subject company's leverage:
Key concept
(D/E = debt to market value of equity.) The peers' average tax rate is used to unlever and the subject company's tax rate to relever. When all firms share one tax rate, the same appears in both steps. Example. Peers have a beta of 1.25 and a D/E of 0.50, and t = 20%, so . With a subject D/E of 0.25, . Lower leverage than the peers means a lower levered beta.
Estimating the market risk premium
| Approach | How | Watch out for |
|---|---|---|
| Historical | average past excess return of an index over the risk-free rate (arithmetic or geometric mean) | assumes the past is an unbiased guide. A boom sample overstates the MRP, which leads to lower valuations. The geometric mean is below the arithmetic mean. |
| Forward-looking | implied by current prices, via the constant growth model | high current prices produce a lower estimate |
Because of these biases, the historical and forward-looking estimates can conflict, and the analyst should revisit the assumptions behind each one.
Choice of risk-free rate: short-term rates are normally lower than long-term rates, so a short-term rate produces a higher MRP. Because equity valuation is long-term, a long-term government rate is more appropriate.
Forward-looking (implied) estimate:
Example. A dividend yield of 1.8% and growth of 6.0% give . With , the MRP is 4.0%.
Emerging markets: country risk premium
For stocks in developing markets, add a country risk premium (CRP), stated in a reserve currency (e.g., USD or EUR), to the market risk premium inside the beta term:
Key concept
The sovereign yield spread is the country's reserve-currency bond yield minus the reserve-currency benchmark yield. The risk-free rate is the benchmark (reserve-currency) yield. The emerging-market sovereign yield already contains the spread and is not used as . Example. A spread of 3.0% with and gives a CRP of 4.5%. With , and an MRP of 5%, .
Common exam traps
- Adjusted beta: weight on the raw beta, on 1.0. Do not swap the weights or forget the term. For the raw beta of 1.45, swapping the weights gives 1.15 and leaving out the 1/3 term gives 0.97, instead of 1.30.
- Unlever with the peers' D/E and tax rate, then relever with the subject's D/E and tax rate. The adjustment appears in both steps. In the example, leaving out in both steps gives an unlevered beta of 0.833 and a levered beta of 1.04, instead of 0.893 and 1.07.
- CRP: multiply the spread by (equity volatility in the numerator), and put CRP inside the bracket multiplied by beta. In the example, inverting the volatility ratio gives a CRP of 2.0% and , and adding the CRP outside the beta term gives 11.5%, instead of 10.6%.
- Forward MRP: subtract . Dividend yield plus growth alone is the expected market return. In the example, stopping at the dividend yield plus growth gives 7.8% instead of an MRP of 4.0%.
Exam shortcuts
- Adjusted beta is a weighted average of the raw beta and 1.0, so it lies between them: a raw beta above 1 is adjusted down and one below 1 is adjusted up, and any answer outside that range can be ruled out.
- When the subject and its peers share one tax rate, a subject with lower leverage than the peers has a lower levered beta than theirs, and one with higher leverage a higher beta.
Bottom line
- The CAPM, , prices only systematic risk, and its security market line has the risk-free rate as intercept and the market risk premium as slope.
- Beta equals and is estimated by regressing the stock's returns on a market proxy over a lookback period, where a longer sample lowers the standard error but may describe a business or capital structure that no longer applies.
- Exam convention: the square root of is described as the stock–index correlation; current practice: it gives the correlation's magnitude, and the sign follows the sign of beta.
- Adjusted beta is , with commonly 2/3, because market model betas tend to revert toward 1.0.
- In the pure-play approach the peers' levered beta is unlevered with the peers' D/E and tax rate and relevered with the subject company's D/E and tax rate, the term appearing in both steps.
- The forward-looking market risk premium is , a long-term government rate is the more appropriate risk-free rate, and for emerging markets the country risk premium, the sovereign yield spread times , is added to the MRP inside the beta term.
Quick check
Eighteen months ago, Galloway Industries sold its stable consumer division and financed a large acquisition mostly with new debt. An analyst estimating Galloway's beta with the market model decides to lengthen the lookback period from 2 years to 8 years. This change will most likely:
Show answer and explanation
Correct answer: C
A longer lookback period gives a larger sample and a lower standard error of beta. However, most of the extra data now come from before Galloway's restructuring, when its business mix and leverage were different. The estimate will therefore describe past conditions rather than the company's future systematic risk.
Why the other options are wrong
- A. The standard error does fall with more observations, but a beta built largely on data from an obsolete business model and capital structure is a poorer guide to future risk.
- B. The mean-reversion adjustment is applied separately to the raw beta. With the usual fixed two-thirds weight on the raw beta, it does not change with the length of the lookback period.
Key takeaway A longer lookback period means less statistical noise but more stale data. After a major change in the business or capital structure, the stale data dominate, and a peer (pure-play) beta is usually the better choice.
Module 50.2
Arbitrage Pricing Theory
LOS 50.b — Arbitrage pricing theory and multifactor models
Why go beyond the CAPM?
Empirical studies show that a single market factor does not adequately explain why returns differ across stocks. This motivates models with several priced risk factors.
Arbitrage pricing theory (APT)
Arbitrage pricing theory (APT) is a framework for estimating expected equity returns with a multifactor model:
Key concept
where is the beta of stock i to the kth risk factor and is the risk premium for the kth risk factor.
APT is a statistical factor model: the theory leaves the choice of factors to the analyst, and researchers have tried both macroeconomic factors and company-specific (style or characteristic) factors. The table contrasts it with the CAPM.
Key concept
| CAPM | APT | |
|---|---|---|
| Number of factors | one | not specified |
| Identity of factors | the market portfolio (priced through the market risk premium) | not specified (macroeconomic, style or other company-specific factors) |
The four-factor model
A widely used specification adds size, value and momentum factors to the market factor:
Each nonmarket factor is the return on a zero-cost, long-short portfolio (equal amounts long and short):
Key concept
| Factor | Long | Short | Positive beta means… | Negative beta means… |
|---|---|---|---|---|
| Size (SMB, small minus big) | small-cap stocks | large-cap stocks | behaves like a small-cap stock | behaves like a large-cap stock |
| Value (HML, high-value minus low-value; high minus low book-to-market) | value stocks | growth stocks | value stock | growth stock |
| Momentum (UMD, up minus down) | recent winners | recent losers | benefits when recent winners keep outperforming | suffers when recent winners outperform |
The betas on these long-short factors are expected to average about zero across stocks, so individual betas are often negative. The market beta, by contrast, averages 1.0, and a market beta of 1.0 means average market risk. Betas are estimated with a multiple regression on historical data.
The sign of a factor beta shows how the stock moves with that factor's long-short return. A stock with a negative beta on a factor tends to underperform when that factor's long side beats its short side. If a factor beta is not given, nothing can be concluded about how the stock responds to that factor.
Example. . Betas and premiums are market 0.9 × 6%, size 0.5 × 2%, value −0.3 × 4%, momentum 0.2 × 5%.
The stock behaves like a small-cap growth stock (size beta positive, value beta negative) with a mild momentum tilt.
Why multifactor models matter in equity investing
- Estimating the cost of equity. A multifactor expected return adds a premium for each factor exposure, so two stocks with the same market beta can have different required returns if one tilts toward small caps or value.
- Describing a stock or portfolio. The signs and sizes of the factor betas summarize its style (large or small, value or growth, momentum or contrarian) without looking at its holdings.
- Choosing peers. Firms with similar factor betas form a statistical factor-based peer group for multiples-based valuation (Reading 45). The caveat is that betas estimated from past data may not persist.
Common exam traps
- Saying APT uses only macroeconomic factors, or that it specifies the factors. It specifies neither the number nor the identity.
- Expecting nonmarket factor betas to average 1 (that is the market beta), or confusing the risk-free rate with a beta.
- Mixing up the legs: size means long small caps, short large caps; value means long value stocks, short growth stocks; momentum means long recent winners, short recent losers.
- Dropping the sign of a negative factor beta when computing expected return. In the example, treating the value term as +1.2% gives 11.6% instead of 9.2%.
Bottom line
- A single market factor does not adequately explain why returns differ across stocks, which motivates multifactor models such as arbitrage pricing theory, .
- APT is a statistical factor model that specifies neither the number nor the identity of its factors, whereas the CAPM has one factor, the market portfolio.
- The four-factor model adds size (SMB), value (HML) and momentum (UMD) factors to the market factor, and each of these three is measured by a zero-cost portfolio holding equal amounts long and short.
- A positive SMB beta means the stock behaves like a small-cap stock and a positive HML beta like a value stock, while negative betas point to large-cap and growth behavior, and a negative factor beta must keep its sign in the expected return.
- Betas on the long-short factors average about zero across stocks, so individual betas are often negative, while the market beta averages 1.0.
- Multifactor models are used to estimate the cost of equity (two stocks with the same market beta can have different required returns), to describe a stock's or portfolio's style, and to form statistical factor-based peer groups, although betas estimated from past data may not persist.
Quick check
An analyst estimates the following four-factor model betas for Tidewater Logistics:
| Factor | Beta |
|---|---|
| Market | 0.90 |
| Size (SMB) | −0.30 |
| Value (HML) | 0.42 |
| Momentum (UMD) | −0.15 |
Based on these betas, Tidewater is most appropriately characterized as a:
Show answer and explanation
Correct answer: C
In the four-factor model the size factor (SMB) is the return on a zero-cost portfolio that buys small-cap stocks and shorts large-cap stocks. Tidewater's negative size beta (−0.30) means it tends to move inversely with small caps, which marks it as a large-cap stock. The value factor is long high book-to-market (value) stocks and short low book-to-market (growth) stocks; Tidewater's positive value beta (0.42) means it moves with value stocks. Together the two signs describe a large-cap value stock. The market beta (0.90) and momentum beta (−0.15) do not bear on the size or style classification.
Why the other options are wrong
- A. A small-cap stock would show a positive beta to the size factor, because it would move with the small-cap long side of that portfolio. Tidewater's size beta is negative (−0.30), so it behaves like a large-cap stock, even though its positive value beta does point to value.
- B. A growth stock would show a negative beta to the value factor, because it would move with the short (low book-to-market) side of that portfolio. Tidewater's value beta is positive (0.42), so the growth label is wrong, even though the large-cap part is right.
Key takeaway Size beta sign: + small, − large. Value beta sign: + value, − growth.
Practice Questions
A broad equity index currently offers a dividend yield of 2.2%, and its earnings and dividends are expected to grow at 5.5% a year over the long term. The risk-free rate is 3.1%. A forward-looking estimate of the market risk premium is closest to:
Show answer and explanation
Correct answer: A
A forward-looking estimate is implied by current prices. Rearranging the constant growth model, the expected market return equals the dividend yield plus the long-term growth rate. Subtracting the risk-free rate gives the implied market risk premium.
Why the other options are wrong
- B. 7.7% is the expected return on the market index (). The risk-free rate has not been subtracted.
- C. 10.8% adds the risk-free rate to the dividend yield and growth instead of subtracting it: .
Key takeaway Forward .
This reading has 14 questions in the full bank. Practice all of them.
Key Takeaways
- A longer lookback period means less statistical noise but more stale data. After a major change in the business or capital structure, the stale data dominate, and a peer (pure-play) beta is usually the better choice.
- Forward .
- Size beta sign: + small, − large. Value beta sign: + value, − growth.