Financial Statement Analysis · Reading 28
Analyzing Income Statements
CFA Level I · Financial Statement Analysis · Reading 28 · about 1 h 47 min
What you'll learn
- LOS 28.a Explain the general principles of revenue recognition, the five-step model, specific recognition issues, and their implications for financial analysis.
- LOS 28.b Explain the matching principle and expense recognition choices (inventory, depreciation, capitalization vs. expensing, estimates) and their effects on financial statements and ratios.
- LOS 28.c Explain how discontinued operations, unusual or infrequent items, accounting changes and error corrections are reported and how analysts should treat them.
- LOS 28.d Calculate and interpret basic and diluted EPS for simple and complex capital structures, including the treatment of antidilutive securities.
- LOS 28.e Evaluate a company's performance using common-size income statements and income-statement ratios such as gross and net profit margin.
Module 28.1
Revenue Recognition
This reading covers how revenue and expenses are recognized, from the five-step revenue model to the choice between capitalizing and expensing, and how nonrecurring items and accounting changes are reported. The calculations to master are revenue on long-term contracts, basic and diluted EPS, and common-size income statements with their margins.
LOS 28.a — Revenue recognition: principles, applications and analysis
The accrual idea
Revenue belongs in the period in which it is earned, that is, when the company has done what it promised. This need not be the period in which cash arrives.
- Credit sale: revenue is recognized at the sale, and an asset, accounts receivable, is recorded.
- Cash received in advance (subscriptions, deposits, gift cards): no revenue is recognized yet. The company records cash and a liability, unearned (deferred) revenue. As the goods or services are delivered, the liability is reduced and revenue is recognized.
- Revenue is reported net of expected returns, discounts and allowances. Exam convention: estimated warranty provisions count as one of the allowances subtracted from revenue when the sale is made. Current practice: a standard (assurance-type) warranty is recognized at the sale as an expense with a matching provision, and a warranty sold as a separate service is a performance obligation whose share of the price is deferred.
The converged standard (IFRS 15 and ASC 606)
The IASB and FASB jointly developed this converged revenue standard. It is principles-based. Instead of many industry-specific rules, it rests on one core principle: recognize revenue when (or as) control of a promised good or service passes to the customer, at the amount the firm expects to be entitled to. The principle is applied through a five-step model:
Key concept
| Step | What the firm does | Key definition |
|---|---|---|
| 1 | Identify the contract with the customer | An agreement between two or more parties that creates enforceable rights and obligations; collection must be probable (IFRS and US GAAP define "probable" differently, so identical deals can be treated differently) |
| 2 | Identify the performance obligations | A promise to transfer a distinct good or service: one the customer can benefit from on its own (or with readily available resources) and that is separately identifiable from the other promises |
| 3 | Determine the transaction price | The amount the firm expects to receive. It is usually fixed but may include variable consideration (bonuses such as one for early delivery, rebates, penalties), included only to the extent that a significant later reversal is highly unlikely |
| 4 | Allocate the price to the obligations | Spread the transaction price across the performance obligations identified in Step 2 |
| 5 | Recognize revenue when (or as) each obligation is satisfied | An obligation is satisfied when control transfers |
Indicators that control has transferred are that the customer has physical possession, has accepted the item, bears the risks and rewards of ownership and holds legal title, and that the seller has a present right to payment.
Exam convention: revenue is recognized only when a later reversal is highly unlikely, so a firm may have to record a refund liability, with an asset for its right to the returned goods, when revenue from a sale cannot be estimated reliably. Current practice: under IFRS 15 and ASC 606, every sale with a right of return gives revenue only for the amount not expected to be refunded, a refund liability for expected refunds and an asset for the goods expected back.
Revenue over time (long-term contracts)
Key concept
An obligation is satisfied over time if any one of these conditions holds:
- The customer receives and consumes the benefit as the firm performs, as with a cleaning or maintenance contract.
- The firm's work creates or enhances an asset that the customer controls as it is built.
- The asset has no alternative use to the seller, and the seller can enforce payment for work done to date.
Progress can be measured by inputs (cost incurred as a share of total expected cost) or by outputs (milestones, units delivered). Costs of securing a long-term contract, such as sales commissions, are capitalized and then expensed over the life of the contract.
A building is usually one performance obligation. Site preparation, foundations, wiring and the roof are not distinct promises, because each is an input to a single combined output that the customer contracted for.
Example. Fenwick Builders agrees to construct a cold-storage facility for $30 million, plus a $3 million bonus if the facility is finished within 18 months. The facility uses a new refrigeration design and the finish date depends on a supplier's delivery schedule, so Fenwick cannot conclude that a reversal of revenue from the bonus is highly unlikely. The bonus is left out of the transaction price, which stays at $30 million. The expected total cost is $25 million. Costs incurred are $8 million in Year 1 and $7 million in Year 2.
- Year 1: , so revenue is million.
- Year 2: , so cumulative revenue is million and Year 2 revenue is million.
The formula always uses the transaction price as currently estimated. Had the bonus become includable by the end of Year 2, cumulative revenue would be million and Year 2 revenue million. Year 1 revenue is not restated, so the bonus share of the Year 1 work is recognized in Year 2.
The amounts billed or collected do not affect these figures. The result is the same as under the older percentage-of-completion method, although the converged standard no longer uses that name.
Specific applications
| Situation | Treatment |
|---|---|
| Principal or agent | A principal controls the good before transfer and reports gross revenue, with the cost as an expense. An agent only arranges the sale, is not responsible for providing the good or service and bears no inventory or credit risk; it reports its net fee or commission. |
| Franchise fees | An upfront fee covering several years is deferred and recognized over the franchise term; royalties are recognized as they become payable. Revenue is disaggregated into categories with similar characteristics (company stores, royalties, supplies). |
| Software license or service | An "as-is" license, with updates and support under a separate contract, gives license revenue at the start; the support revenue is recognized as the service is provided, usually over the contract. A license under which the supplier keeps updating the software, the customer is exposed to the effects of those updates, and the updates are not a separate transfer of goods or services gives revenue over the contract. Cloud access without taking possession of the software is a service recognized over time. |
| Bill-and-hold | The customer pays before shipment. Such a payment is normally deferred revenue. Revenue before shipment is allowed only if the seller has completed its obligations, the customer has control, the customer requested the arrangement, and the goods are identified as the customer's, are ready for delivery and cannot be redirected. |
Example. An online travel platform sells an €800 cruise cabin and keeps a €60 commission. As an agent it reports revenue of €60, a gross margin of 100%. If it were the principal, it would report €800 of revenue and €740 of cost, a gross margin of 7.5%. Gross profit is €60 either way, but revenue and margins differ sharply, which creates a comparability problem.
Disclosures and analysis
Firms must disclose contracts by category, contract assets and liabilities (and changes in them), remaining performance obligations with the price allocated to them, and the judgments used on timing and amount. Analysts should watch the choices that move revenue between periods: the measure of progress, estimates of variable consideration, contract modifications, and principal-versus-agent classification.
Common exam traps
- Treating cash received as revenue. Advance payments create a liability.
- Confusing the contract (step 1) with a performance obligation (a distinct promise within the contract, step 2).
- Calling the converged standard "rules-based." It is principles-based.
- In over-time questions, reporting cumulative revenue for the year instead of subtracting revenue already recognized. For Fenwick, this reports Year 2 revenue of $18.0 million instead of $8.4 million.
- Reporting an agent's revenue at the gross sale price. Agents report net commission revenue. For the cruise cabin, this reports €800 of revenue instead of €60.
Exam shortcuts
- In an over-time contract measured by inputs, amounts billed or collected can be ignored: cumulative revenue depends only on the cumulative cost to date, the total expected cost and the current transaction price.
Bottom line
- Under IFRS 15 and ASC 606, revenue is recognized when (or as) control of a promised good or service passes to the customer, at the amount the firm expects to be entitled to.
- The five steps are: identify the contract with the customer; identify its performance obligations; determine the transaction price; allocate that price to the obligations; and recognize revenue when (or as) each obligation is satisfied.
- Cash received before goods or services are delivered is recorded as a liability, unearned (deferred) revenue, and becomes revenue as the delivery takes place.
- Variable consideration such as a bonus enters the transaction price only to the extent that a significant later reversal is highly unlikely.
- With an input measure of progress, cumulative revenue equals cumulative cost to date divided by total expected cost, times the transaction price, and the period's revenue is that figure less revenue already recognized.
- A principal controls the good before transfer and reports gross revenue with the cost as an expense; an agent only arranges the sale and reports its net fee or commission.
Quick check
On November 15, Halden Yacht Services receives $24,000 in cash from a customer for a winter storage and maintenance package that Halden will provide from January through March. Halden has not yet performed any of the service. At November 30, the effect of this transaction on Halden's balance sheet is best described as:
Show answer and explanation
Correct answer: B
Revenue is recognized when it is earned, that is, as the promised service is provided. Cash received before any service is delivered creates a liability, unearned (deferred) revenue, because Halden still owes the customer the service. The asset cash rises by $24,000 and the liability rises by the same amount; no revenue, and therefore no retained earnings, is recognized yet.
Why the other options are wrong
- A. This treats the prepayment as revenue that raises net income and retained earnings. No service has been performed, so no revenue has been earned by November 30.
- C. The customer has already paid, so there is no receivable, and revenue is not recognized before the service is provided.
Key takeaway Cash received in advance is a liability, unearned revenue. It becomes revenue only as the goods or services are delivered.
Module 28.2
Expense Recognition
LOS 28.b — Expense recognition, capitalization and expensing
How expenses are recognized under accrual accounting
An expense is a decrease in economic benefits (assets used up or liabilities incurred) that lowers equity other than through distributions to owners. Under the accrual basis, an expense is recognized when the benefit is consumed, whether or not cash has been paid. Three routes achieve this:
Key concept
| Route | Idea | Examples |
|---|---|---|
| Matching | Costs that generate revenue are expensed in the same period as that revenue | Cost of goods sold is expensed when the goods are sold; estimated warranty cost and bad debt expense are recorded in the period of the sale |
| Expensing as incurred (period costs) | Costs that cannot be tied to specific revenue are expensed in the period they relate to | Head-office salaries, rent for the year (paid or not), interest accrued on a loan (paid or not) |
| Capitalization | Costs that bring benefits over several periods are recorded as an asset and expensed gradually | PP&E (depreciation), finite-life intangibles (amortization), natural resources (depletion) |
Production or purchase costs stay on the balance sheet as inventory until the goods are sold. If nothing is sold in a period, none of those costs reaches the income statement.
A policy that recognizes expenses later is aggressive because it raises current income. A policy that recognizes them sooner is conservative, so expensing an outlay is more conservative than capitalizing it.
Recording a credit sale
When goods costing 70 are sold on credit for 100, receivables rise by 100 and inventory falls by 70, so total assets rise by 30. Retained earnings (equity) rise by the profit of 30, and liabilities are unaffected (ignoring taxes).
Inventory cost-flow methods
Specific identification assigns each unit its own actual cost. It suits goods that can be tracked one by one, such as vehicles recorded by serial number. When individual units cannot be tracked this way, the firm assumes a cost flow:
| Method | COGS contains | Physical flow it resembles | With rising prices |
|---|---|---|---|
| FIFO | Oldest costs | Units sold in the order produced (perishables, dated goods) | Lowest COGS, highest gross margin and net income; ending inventory near current cost |
| LIFO (US GAAP only; not permitted under IFRS) | Newest costs | Units taken from the top of a heap (road salt, sand) | Highest COGS, lowest margins and income |
| Weighted average cost | Average cost | Units drawn from a mixed stock | In between |
Revenue is unaffected by the method, so differences in COGS pass directly into margins. Analysts comparing firms must adjust for different methods.
Depreciation methods
The depreciable base is cost minus salvage value. Straight-line spreads it evenly over the useful life.
Example. A press costs $60 million, has a salvage value of $12 million and a 6-year life. Straight-line depreciation is million a year.
Intangible assets
- Finite-life intangibles (patents, licenses, customer lists) are amortized over their useful lives.
- Indefinite-life intangibles (acquired goodwill, some trademarks or licenses renewable at little cost) are not amortized. They are tested for impairment at least annually under both IFRS and US GAAP.
- Most internally generated intangibles are expensed. Research costs (aimed at new scientific or technical knowledge) are expensed. Under IFRS, development costs (turning research findings into a plan or design for a new product or process) may be capitalized. Among other criteria, the firm must show that it is able to finish the asset and plans to use or sell it. Under US GAAP, R&D is generally expensed; the main exception is software developed for sale, which is capitalized after technological feasibility is established.
- When one firm capitalizes development costs and a peer expenses them, to make the two comparable, an analyst expenses the period's development spending and removes the amortization of earlier capitalized amounts from the income statement. On the balance sheet the capitalized asset is removed, which lowers assets and equity. In the cash flow statement the outlay moves from CFI to CFO, so CFO falls.
Capitalizing and expensing
An outlay expected to bring economic benefits over more than one period is capitalized. If the future benefit is unlikely or highly uncertain, it is expensed. The chart shows the decision and the route by which each kind of capitalized cost later reaches the income statement (see the figure below). A capitalized asset's cost includes the purchase price plus the costs needed to get the asset ready for use (freight, installation, non-recoverable taxes). Except for land and indefinite-life intangibles, that cost is then spread over the asset's life as depreciation, depletion or amortization. Later outlays that extend the asset's life or add capacity are also capitalized. Routine repairs, maintenance and staff training are expensed.
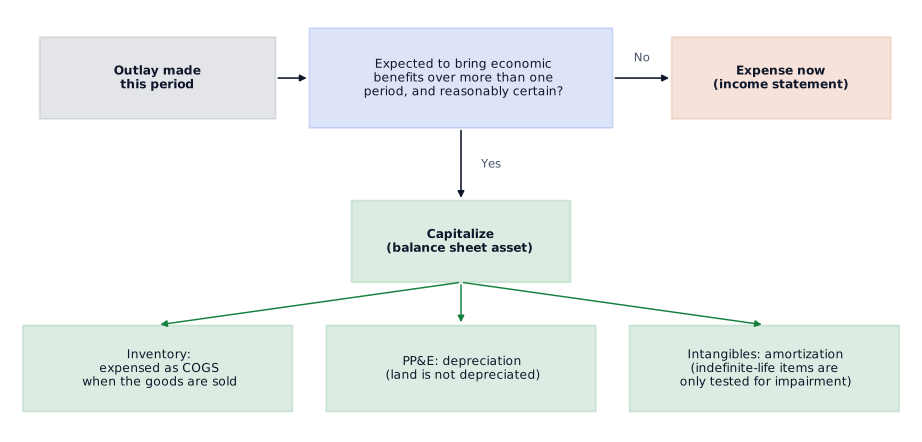
Example. A bakery buys an oven for $48,000. It also pays $1,500 for delivery, $900 for installation, $400 for test bakes before the oven goes into use and $1,200 to train its staff. The oven is recorded at . The $1,200 of training is expensed, because it does not get the oven ready for use.
Key concept
| Effect of capitalizing (compared with expensing) | Year of outlay | Later years |
|---|---|---|
| Net income, net margin | Higher | Lower (depreciation continues) |
| Total assets, equity | Higher (the extra asset is matched by higher retained earnings; liabilities are unchanged) | Higher, gap shrinks to zero |
| ROA, ROE | Higher | Lower |
| Asset turnover | Lower | Lower, gap shrinks |
| Earnings volatility | Lower (smoother) | Not applicable |
| Cash flow from operations | Higher (outflow sits in CFI) | Same if tax ignores the choice; higher if depreciation is deducted for tax |
| Cash flow from investing | Lower | Same |
| Debt-to-assets, debt-to-equity | Lower | Lower |
Total cash flow is the same under both choices, provided the tax treatment does not depend on the accounting choice; only the classification between CFO and CFI differs. If the tax deduction follows the accounting choice, expensing brings the whole tax saving into the year of the outlay. Total cash flow is then higher in that year under expensing, CFO is higher in later years under capitalization (depreciation keeps reducing tax), and cumulative cash is the same by the end of the asset's life.
Example. A new firm buys a machine for $20,000 with a 5-year life and no salvage value. Operating profit before the machine is $25,000 a year, the tax rate is 25%, and depreciation is tax deductible.
- Capitalize: depreciation is $4,000, so net income is every year. CFO is every year, and CFI is −$20,000 in Year 1.
- Expense: Year 1 net income is , which is also Year 1 CFO. Years 2–5 net income and CFO are .
- Year 1 total cash flow is −$250 when capitalizing and $3,750 when expensing. Capitalization then gives $1,000 more CFO in each of Years 2–5, and five-year cash totals are $78,750 either way.
- Cumulative net income over the five years is also $78,750 under both choices . The choice moves income between years; it does not change the total.
The table describes a single outlay. A firm that capitalizes similar costs every year keeps reporting higher income than an expensing peer for as long as the amount capitalized each period exceeds that period's depreciation or amortization of the capitalized costs.
Capitalized interest
Interest incurred while a firm builds an asset for its own use must be capitalized as part of the asset's cost under both IFRS and US GAAP. In limited cases this also applies to an asset built for sale. Capitalized interest is not shown as interest expense. It later reaches income through depreciation (asset held for use) or COGS (asset held for sale), and the cash paid appears in investing cash flow. As with any capitalized cost, net income is higher while the asset is being built and lower in later years. In those later years EBIT is also lower, because the interest now sits inside depreciation, an operating expense. Exam convention: interest paid that is not capitalized is an operating outflow under US GAAP and an operating or financing outflow under IFRS. Current practice: under IFRS 18, effective for annual periods beginning on or after 1 January 2027, a company whose main business is not financing reports interest paid in CFF.
For interest coverage, analysts add the interest capitalized in the period to interest expense. They also add the depreciation of previously capitalized interest back to EBIT, because it is economically an interest cost rather than an operating cost.
Key concept
Example. A utility reports EBIT of $90 million and interest expense of $30 million. It capitalized $15 million of interest this year, and depreciation includes $6 million of interest capitalized in earlier years. Reported coverage is . Adjusted coverage is . Had the $15 million been expensed, CFO would be $15 million lower and CFI $15 million higher (less negative), ignoring taxes and with interest paid classified in CFO, as under US GAAP.
Analyzing estimates
Bad-debt, warranty, useful-life and salvage estimates give management room to shift income. Analysts should ask why an estimate changed and compare it with peers. The footnotes and MD&A disclose accounting policies and significant estimates.
Example. A heater maker has Year 1 sales of $1,000,000 and expects warranty repairs to cost 4% of sales. It records warranty expense of $40,000 in Year 1, the year of the sales, together with a warranty provision (a liability) of the same amount. Repairs of $35,000 carried out in Year 2 are charged against the provision, so they are not Year 2 expense. Had management assumed 2%, Year 1 pretax income would have been $20,000 higher. A warranty rate well below that of peers may reflect better products or more aggressive expense recognition, and the analyst should find out which.
Common exam traps
- Believing costs are expensed when paid. Accrued interest and rent are expenses of the period even if unpaid.
- Expensing inventory costs when incurred. They are expensed when the goods are sold.
- Reversing the FIFO and LIFO results. With rising prices, FIFO gives the highest margins and LIFO the lowest.
- Amortizing goodwill. Indefinite-life intangibles are only tested for impairment.
- Thinking capitalized interest is an IFRS-only or US GAAP-only rule. Both require it.
- Forgetting to deduct salvage value when computing straight-line depreciation. For the press, this gives $10.0 million a year instead of $8.0 million.
Bottom line
- Under accrual accounting, an expense is recognized when the benefit is consumed, whether or not cash has been paid: by matching it with revenue, as a period cost, or by capitalizing it and expensing it gradually.
- With rising prices, FIFO gives the lowest COGS and the highest gross margin and net income, LIFO (US GAAP only) gives the highest COGS and the lowest margins, and weighted average cost falls in between.
- Straight-line depreciation equals cost minus salvage value, divided by the useful life.
- Indefinite-life intangibles such as acquired goodwill are not amortized but are tested for impairment at least annually; research costs are expensed, development costs may be capitalized under IFRS, and US GAAP generally expenses R&D except software developed for sale once technological feasibility is established.
- Compared with expensing, capitalizing an outlay gives higher net income, ROA, ROE and CFO but lower CFI in the year of the outlay, higher assets and equity, lower debt ratios, and lower net income, ROA and ROE in later years.
- Interest incurred while a firm builds an asset for its own use is capitalized under both IFRS and US GAAP, and adjusted interest coverage is (EBIT + depreciation of capitalized interest) / (interest expense + interest capitalized).
Quick check
Three U.S. hardware retailers are identical except for their inventory cost-flow assumption: one uses FIFO, one uses LIFO and one uses weighted average cost. Over the past several years, both the unit costs they pay suppliers and the number of units they sell have climbed steadily. An analyst who ranks the three on reported gross profit margin, without adjusting for inventory accounting, would most likely find the lowest margin at the retailer using:
Show answer and explanation
Correct answer: A
With rising purchase prices, LIFO charges the most recent, and therefore highest, costs to cost of goods sold. Revenue is the same whatever cost-flow method is used, so the higher COGS under LIFO produces the lowest gross profit (and net profit) margins.
Why the other options are wrong
- B. Weighted average cost blends older, cheaper units with newer, dearer ones, so its COGS and margins fall between those under FIFO and LIFO.
- C. FIFO charges the oldest, cheapest costs to COGS when prices are rising, so FIFO firms report the lowest COGS and the highest margins.
Key takeaway With rising prices, FIFO gives the lowest COGS and the highest margins, LIFO the highest COGS and the lowest margins, and average cost falls in between. Sales are unaffected by the choice.
Module 28.3
Nonrecurring Items
LOS 28.c — Nonrecurring items and accounting changes
Analysts forecast sustainable earnings, so they need to know which income statement items are likely to repeat. The standards give certain items special placement or treatment.
Unusual or infrequent items
Unusual or infrequent items are material items that are unusual in nature or infrequent in occurrence. Examples are:
- gains or losses on selling assets or parts of the business outside ordinary operations;
- impairments, write-downs and write-offs;
- restructuring charges.
They are reported within income from continuing operations, before tax, often as a separate line. Analysts should judge whether they are really one-off: a company with "unusual" charges almost every year is in effect reporting a recurring cost.
Discontinued operations
A discontinued operation is a component that management has decided to dispose of (and that is classified as held for sale) or has already disposed of during the period. Exam convention: the business must be physically and operationally separable from the rest of the firm in its assets, operations, and investing and financing activities. Current practice: IFRS 5 also requires a separate major line of business or geographical area (or a subsidiary bought only for resale), and US GAAP requires a strategic shift with a major effect on operations, so selling a minor product line or individual assets is not a discontinued operation.
- The measurement date is the date a formal disposal plan is adopted. The phaseout period runs from then to the actual disposal.
- The operation's income or loss, and any gain or loss on disposal, is reported after income from continuing operations, net of tax. Prior-period income statements presented are restated to show it separately.
- Once the component is held for sale, its assets are measured at the lower of carrying amount and fair value less costs to sell. An expected loss on disposal is therefore recognized immediately as a write-down. An expected gain is recognized only when the sale is completed.
- Exam convention: on the measurement date the firm accrues the estimated operating losses of the phaseout period along with any estimated loss on the sale. Current practice: IAS 37 prohibits provisions for future operating losses other than for onerous contracts, and US GAAP reports the results of a discontinued operation in the periods in which they occur. Under both frameworks, phaseout-period operating losses are therefore reported in discontinued operations as they are incurred.
- Analysts usually exclude discontinued operations when forecasting earnings, although the disposal itself can signal something about future cash flows.
Accounting changes
Key concept
| Type | Example | Treatment |
|---|---|---|
| Change in accounting policy (principle) | Switching inventory from FIFO to weighted average cost; adopting a new standard issued by the standard setter | Retrospective: unless this is impractical, prior periods presented are restated as if the new policy had always applied, so the periods stay comparable. A new standard may allow modified retrospective adoption, with no restatement and the cumulative effect adjusted in opening balances. |
| Change in accounting estimate | Revised useful life, salvage value, bad-debt rate or warranty rate | Prospective: current and future periods only, with no restatement. Usually no cash flow effect. |
| Correction of a prior-period error | Moving from an incorrect method to an acceptable one; fixing omitted or misstated amounts | Prior-period adjustment, applied retrospectively: prior statements presented are restated, and the nature of the error and its effect on net income are disclosed. Usually no cash flow effect. Errors may indicate weak internal controls. |
Example. Aldercrest Mills bought a machine for $900,000 with no salvage value and a 9-year life. After 3 years, when the carrying value is $600,000, it concludes that the machine will last 5 more years (8 years in total). This is a change in estimate.
The depreciation of $100,000 per year for Years 1–3 is not restated; the new amount applies from Year 4 onward.
Changes in scope and exchange rates
Acquisitions (changes in scope, which alter the size of the combined entity) and currency movements (which change the reporting-currency value of foreign sales, purchases and subsidiaries' results) can distort year-on-year comparisons, even though the standards do not require their effects to be isolated. Analysts should adjust for them where possible.
Where items appear
Key concept
| Item | Location | Tax presentation |
|---|---|---|
| Unusual or infrequent items | In income from continuing operations | Pre-tax |
| Discontinued operations | Below income from continuing operations | Net of tax |
| Policy change or error correction | Restated prior periods (and opening retained earnings) | Not a current-period income line |
| Estimate change | Current and future period expenses | Ordinary lines |
Example. Brackwell Foods earns operating income of $52 million before a $12 million restructuring charge. Interest expense is $6 million and the tax rate is 25%. A frozen-meals division that is held for sale lost $4 million after tax.
| Line | Amount (millions) |
|---|---|
| Operating income before the restructuring charge | 52.0 |
| Restructuring charge (unusual or infrequent, pretax) | (12.0) |
| Operating income | 40.0 |
| Interest expense | (6.0) |
| Income before tax | 34.0 |
| Income tax at 25% | (8.5) |
| Income from continuing operations | 25.5 |
| Loss from discontinued operations, net of tax | (4.0) |
| Net income | 21.5 |
The forecast therefore starts from income from continuing operations of $25.5 million. If the restructuring is truly a one-off, recurring after-tax income is million; if Brackwell restructures most years, the $25.5 million figure stands.
Common exam traps
- Changes in useful life or salvage value are changes in estimates, applied prospectively. They are not policy changes.
- Error corrections are neither unusual items nor policy changes. They are prior-period adjustments with restatement.
- Unusual or infrequent items are pre-tax and inside continuing operations. Only discontinued operations are shown net of tax below that line.
Bottom line
- Unusual or infrequent items are shown pre-tax within income from continuing operations, and an analyst judges whether they really are one-off.
- Discontinued operations are reported net of tax below income from continuing operations, prior-period income statements presented are restated to show them separately, and analysts usually exclude them when forecasting earnings.
- Assets of a component held for sale are measured at the lower of carrying amount and fair value less costs to sell, so an expected loss on disposal is recognized at once and an expected gain only when the sale is completed.
- A change in accounting policy is applied retrospectively, restating the prior periods presented unless that is impractical, while a change in accounting estimate is applied prospectively with no restatement.
- A correction of a prior-period error is a prior-period adjustment: prior statements presented are restated, and the nature of the error and its effect on net income are disclosed.
- After a change in an asset's estimated life, new annual depreciation equals carrying value divided by remaining life, and earlier depreciation is not restated.
Quick check
During the current year, Brantley Industrial recorded a $14 million restructuring charge to close two of its warehouses. Its board also approved a formal plan to sell Brantley's marine-engine business, a separate major line of business with its own plants, management and financing that can be clearly separated from the rest of the company. The business meets the criteria to be classified as held for sale, and the sale is expected to close next year at a gain. Which statement about Brantley's income statement for the current year is most accurate?
Show answer and explanation
Correct answer: A
The marine-engine business is a separate major line of business, physically and operationally distinct, and it is held for sale under a formal disposal plan. It therefore qualifies as a discontinued operation. Its income or loss is reported separately, net of tax, after income from continuing operations, and the prior-period income statements presented are restated so that the discontinued business is shown separately in every year.
Placement of the two items:
| Item | Where it is reported | Tax presentation |
|---|---|---|
| Restructuring charge (an unusual or infrequent item) | Within income from continuing operations | Pre-tax |
| Marine-engine business (discontinued operation) | After income from continuing operations | Net of tax |
The measurement date is the date the formal plan was approved; the period until the sale closes is the phaseout period. Had a loss on the sale been expected, the held-for-sale assets would be written down at once to fair value less costs to sell. Operating results of the phaseout period are recognized as they occur, and future operating losses are not accrued in advance. An expected gain is not recognized until the sale is completed.
Why the other options are wrong
- B. A restructuring charge is an unusual or infrequent item, so it is reported before tax, within income from continuing operations. Only discontinued operations are shown net of tax below that line.
- C. An expected gain on disposal cannot be recognized until the sale is actually completed. Only an expected loss on disposal is recognized early, as a write-down of the held-for-sale assets to fair value less costs to sell. Operating losses of the phaseout period are not accrued in advance either; they are recognized as incurred.
Key takeaway Unusual or infrequent items: pre-tax, inside continuing operations. Discontinued operations: net of tax, below continuing operations, with prior periods restated. Analysts usually exclude discontinued operations when forecasting earnings.
Module 28.4
Earnings Per Share
LOS 28.d — Basic and diluted earnings per share
Earnings per share (EPS) shows how much of the period's profit belongs to each common share. Only companies with publicly traded shares must report it, and it is always expressed per common share. There is no EPS figure for preferred shares.
Simple and complex capital structures
| Capital structure | What it contains | EPS the firm must report |
|---|---|---|
| Simple capital structure | Common stock, nonconvertible bonds and nonconvertible preferred stock; nothing that could become new common shares | Basic EPS only |
| Complex capital structure | At least one potentially dilutive security: convertible bonds, convertible preferred stock, stock options or warrants | Both basic and diluted EPS |
Straight (nonconvertible) debt and nonconvertible preferred stock cannot create new common shares, so they do not make a capital structure complex. Other features, such as a call feature, a cumulative dividend or a sinking fund, do not change this.
Exam convention: a company with a simple capital structure reports basic EPS only. Current practice: that is the US GAAP rule (ASC 260). IFRS (IAS 33) requires every company within its scope to present both basic and diluted EPS; with no dilutive potential shares the two figures are equal.
Basic EPS
Key concept
- The numerator is income available to common shareholders. Subtract the current year's preferred dividends.
- Common dividends are not subtracted. They are a distribution of income that already belongs to common shareholders.
- Convertible securities do not enter basic EPS at all: there is no add-back in the numerator and no extra shares in the denominator.
Weighted average shares outstanding
Each block of shares is weighted by the fraction of the year it was outstanding. Strictly, the weight is days outstanding divided by days in the year; exam questions normally use months.
- New shares (sold for cash, issued in an acquisition, or treasury shares reissued) count from the issue date.
- Repurchased (treasury) shares drop out from the repurchase date.
- Stock dividends and stock splits, including a reverse stock split, are applied retroactively. Every share outstanding before the event is restated as if the event had happened at the start of the year, and prior-year figures are restated too, so EPS does not appear to fall because of a largely cosmetic change in the share count. Shares issued or repurchased after the event are not adjusted for it.
- A split or stock dividend brings in no new resources and leaves each holder's percentage of the company unchanged. Its date within the year therefore does not change how the shares outstanding before it are restated: a 2-for-1 split in late March and one in early November both double the opening shares for the full year.
- A 3-for-2 split and a 50% stock dividend have the same effect: each old share becomes 1.5 new shares. A 1-for-4 reverse split multiplies pre-event shares by 0.25.
- Issuing preferred shares has no effect on the common share count.
Example. Wrenfield Tools starts the year with 60,000 common shares. It sells 12,000 new shares on 1 March, executes a 3-for-2 stock split on 1 June and repurchases 9,000 shares on 1 October. Net income is $450,000, and dividends on its nonconvertible preferred stock are $39,000. Common dividends of $50,000 were also paid.
| Block | Split factor | Months | Weighted shares |
|---|---|---|---|
| 60,000 opening shares | ×1.5 | 12/12 | 90,000 |
| 12,000 issued 1 March | ×1.5 | 10/12 | 15,000 |
| 9,000 repurchased 1 October | none (after split) | 3/12 | −2,250 |
| Weighted average | 102,750 |
The $50,000 of common dividends plays no part in the calculation. When comparing EPS across years, check whether a change comes from earnings or from the share count: repurchases can raise EPS while net income and margins stay flat.
Diluted EPS and the if-converted method
Diluted EPS shows the worst case for existing shareholders: what EPS would be if every dilutive security had been converted or exercised at the start of the year, or on its issue date if it was issued during the year.
Key concept
Convertibles are handled with the if-converted method, which assumes conversion even if the terms did not allow it during the period.
Convertible preferred stock. If the shares were converted, the preferred dividends would not be paid. Add them back to the numerator (they were subtracted to get income available to common) and add the conversion shares to the denominator. There is no tax adjustment, because preferred dividends are not tax-deductible.
Convertible bonds. If the bonds were converted, the interest would not be paid, but the tax deduction on that interest would also be lost. Add back the after-tax interest, , and add the conversion shares. If the bonds were issued part-way through the year, weight both the interest add-back and the shares by the fraction of the year the bonds were outstanding.
Options and warrants. These are handled with the treasury stock method. There is no numerator adjustment, because exercise saves no expense. Assume exercise, and assume that the cash received is used to repurchase shares at the average market price for the period:
Key concept
where is the number of shares issuable, is the exercise price and is the average market price. Options are dilutive only when , that is, when they are in the money on average. The year-end price plays no part.
Testing for dilution
A security is dilutive if including it lowers EPS, and antidilutive if including it would raise EPS or reduce a loss per share. Antidilutive securities are excluded from diluted EPS, so diluted EPS can never exceed basic EPS.
A quick test for a convertible is to compute its per-share effect and compare it with basic EPS:
If the ratio is below basic EPS, the security is dilutive; if it is above, the security is antidilutive. Each potentially dilutive security is tested on its own.
When a company reports a net loss available to common shareholders, adding shares would make the loss per share smaller. All potential shares are then antidilutive, and diluted EPS equals basic EPS.
Example. Ridgeback Instruments has net income of $3,000,000 and 900,000 weighted average common shares. It also has:
- 6% convertible preferred stock paying $300,000 of dividends, convertible into 250,000 common shares;
- 100,000 options exercisable at $40, with an average share price of $50 (year-end price $58);
- $2,000,000 of 8% convertible bonds, convertible into 30,000 shares, with a tax rate of 25%.
Basic EPS .
| Security | Numerator add-back | Extra shares | Per-share effect | Result |
|---|---|---|---|---|
| Conv. preferred | $300,000 | 250,000 | $1.20 | Dilutive (below $3.00) |
| Options | $0 | $0 | Dilutive (X below average price) | |
| Conv. bonds | 30,000 | $4.00 | Antidilutive, so excluded |
Including the bonds would raise EPS to , which confirms that they are antidilutive. The $58 year-end price plays no role.
Common exam traps
- Subtracting common dividends from net income. Only preferred dividends are subtracted. For Wrenfield, subtracting the $50,000 gives $3.51 instead of $4.00.
- Forgetting to restate pre-event shares for a split or stock dividend, or restating shares issued after it. For Wrenfield, leaving the opening and 1 March shares unrestated gives 67,750 weighted shares and EPS of $6.07 instead of 102,750 and $4.00.
- Adding back pre-tax instead of after-tax interest for convertible bonds, or applying a tax adjustment to preferred dividends.
- Using a full year of interest and shares for convertibles issued during the year.
- Using the year-end price instead of the average price in the treasury stock method, or including out-of-the-money options. For Ridgeback, the $58 year-end price gives about 31,034 incremental shares and diluted EPS of $2.54 instead of 20,000 and $2.56.
- Including convertible shares in the basic EPS denominator.
- Including an antidilutive security. Diluted EPS must be less than or equal to basic EPS.
Exam shortcuts
- A convertible is dilutive when its per-share effect (preferred dividends, or interest × (1 − t), divided by the shares on conversion) is below basic EPS, so each convertible can be tested without computing diluted EPS with and without it.
- Options or warrants whose exercise price is not below the average market price are not dilutive, so they can be dropped before applying the treasury stock method.
- When a company reports a net loss available to common shareholders, every potential share is antidilutive and diluted EPS equals basic EPS, so no dilution test is needed.
Bottom line
- Basic EPS equals net income minus preferred dividends, divided by the weighted average number of common shares outstanding; common dividends are not subtracted.
- Stock dividends and stock splits are applied retroactively to all shares outstanding before the event, as if it had happened at the start of the year, and shares issued or repurchased after the event are not adjusted.
- Exam convention: a company with a simple capital structure reports basic EPS only. Current practice: that is the US GAAP rule, while IFRS requires every company within its scope to present both basic and diluted EPS.
- Under the if-converted method, diluted EPS adds back convertible preferred dividends and convertible debt interest × (1 − t) to the numerator and adds the conversion shares to the denominator.
- Under the treasury stock method, options and warrants add shares, where is the average market price, and they are dilutive only when .
- A security that would raise EPS or reduce a loss per share is antidilutive and is excluded, so diluted EPS can never exceed basic EPS.
Quick check
Ravensworth Holdings entered 2025 with 3,000,000 common shares. Its capital transactions during the year, listed from latest to earliest, were: a sale of 240,000 new common shares on 31 October; an issue of €15 million of 6% convertible bonds on 31 May, convertible into common shares at a conversion price of €10; and a 20% stock dividend distributed on 28 February. The number of shares Ravensworth should use for its 2025 basic EPS is:
Show answer and explanation
Correct answer: B
Basic EPS ignores potential shares from convertible securities, so the convertible bonds are not counted. The stock dividend is applied retroactively to the opening shares, and the new shares sold on 31 October are weighted for the remaining two months.
Opening shares restated: (all year).
New shares: .
(Monthly form: .) The €15 million of convertible bonds would convert into 1,500,000 shares, which matters only for diluted EPS.
Why the other options are wrong
- A. 3,540,000 treats the 600,000 dividend shares as outstanding only from 28 February (3,000,000 × 2/12 + 3,600,000 × 10/12 + 40,000). A stock dividend is applied retroactively to the start of the year.
- C. 5,140,000 adds the 1,500,000 shares issuable on conversion of the convertible bonds (€15,000,000/€10). Potential shares from convertibles are excluded from basic EPS.
Key takeaway Basic EPS denominator excludes convertibles; stock dividends are retroactive; new issues are time-weighted.
Module 28.5
Ratios and Common-Size Income Statements
LOS 28.e — Common-size income statements and margin analysis
Vertical common-size income statement
In a vertical common-size income statement, every line is divided by revenue (sales) for the same period, so revenue . This removes the effect of size and lets an analyst compare:
- the same firm across years (time-series or trend analysis), and
- different firms in the same period (cross-sectional analysis), however different their scale.
Key concept
A common-size figure shows the cost per unit of revenue. It does not show the absolute amount. If cost of sales goes from 55% to 60% of revenue, it has risen relative to sales; whether it rose in currency terms depends on what happened to revenue.
Tax is the exception. Tax expense is more informative relative to pretax income:
The rate can be computed directly from common-size percentages because revenue cancels out. For example, tax of 6% of sales divided by pretax income of 24% of sales gives .
Margin ratios
Any subtotal divided by revenue is a margin:
The differences between successive margins isolate each cost layer, all as a percentage of revenue:
Key concept
| Gap | What it measures |
|---|---|
| 100% − gross margin | Cost of goods sold |
| Gross margin − operating margin | Operating expenses (SG&A, R&D, depreciation) |
| Operating margin − pretax margin | Net nonoperating expense (mainly interest, net of investment income) |
| Pretax margin − net margin | Income tax expense |
Gross margin improves when a firm raises prices or cuts unit production costs. Product differentiation (brand, technology, patents) supports higher prices. Administrative costs do not affect gross margin. Net margin reflects every cost, including financing and tax. Both should be compared over time and against peers.
The table below shows what moves gross margin when there are no fixed production costs. A product sells for $50 and costs $30 per unit to make, a 40% gross margin.
| Change | New gross margin |
|---|---|
| Unit volume +15% | Still , because revenue and COGS grow together |
| Unit cost −6% (to $28.20) | |
| Selling price +5% (to $52.50) | |
| Administrative costs −10% | Unchanged; admin is below gross profit (it raises operating and net margin instead) |
Common-size statements are also a starting point for strategy analysis. A firm that spends a larger share of revenue on research or marketing may be building the product differentiation that later shows up as a higher gross margin.
Example. Ashgrove Outfitters reports these margins as a percentage of revenue:
| Year 1 | Year 2 | Year 3 | |
|---|---|---|---|
| Gross margin | 42% | 42% | 42% |
| Operating margin | 16% | 18% | 20% |
| Pretax margin | 14% | 16% | 18% |
| Net margin | 10.5% | 12% | 13.5% |
- COGS is a steady 58% of revenue.
- Operating expenses fell from 26% to 22% of revenue, so the whole improvement comes from cost control below gross profit.
- Nonoperating expense is a stable 2%, so financing costs are unchanged relative to sales.
- The effective tax rate is every year.
Example. Firm P has revenue of $50 million, gross profit of $15 million and operating profit of $4 million. Firm Q has revenue of $8 million, gross profit of $5.2 million and operating profit of $2.4 million. P earns more in absolute terms, but Q's gross margin (65% against 30%) and operating margin (30% against 8%) are far higher. Q is relatively more profitable, perhaps because its product is differentiated.
Common exam traps
- A rising common-size percentage does not prove that the absolute amount rose; revenue may have fallen.
- A higher tax-to-sales ratio does not mean a higher tax rate. Divide tax by pretax income.
- An improvement in net margin can come from any layer. Check which gap actually moved.
- A constant interest-to-sales ratio suggests stable reliance on debt relative to activity. It does not by itself measure leverage, which needs the balance sheet.
- Vertical common-size income statements use revenue as the base. Assets and gross profit are not used as the base.
Exam shortcuts
- The effective tax rate can be read straight from common-size figures: tax as a percentage of sales divided by pretax income as a percentage of sales, because revenue cancels.
Bottom line
- A vertical common-size income statement divides every line by revenue for the same period, which removes the effect of size for time-series and cross-sectional comparison.
- The effective tax rate is income tax expense divided by pretax income, not tax as a percentage of revenue.
- Gross, operating, pretax and net profit margin are gross profit, operating profit (EBIT), earnings before tax and net income, each divided by revenue.
- As a percentage of revenue, gross margin minus operating margin is operating expenses, operating margin minus pretax margin is net nonoperating expense, and pretax margin minus net margin is income tax expense.
- Gross margin improves when a firm raises prices or cuts unit production costs, product differentiation supports higher prices, and administrative costs do not affect gross margin.
Quick check
An analyst reviews the following margins for Halvorsen Marine:
| Margin (% of revenue) | Year 1 | Year 2 | Year 3 |
|---|---|---|---|
| Gross profit margin | 30% | 32% | 34% |
| Operating profit margin | 21% | 23% | 25% |
| Pretax margin | 19% | 19% | 19% |
| Net profit margin | 14% | 14% | 14% |
Halvorsen's net profit margin has stayed flat even though its gross profit margin has widened. Based only on these data, the most likely explanation is an increase, relative to revenue, in:
Show answer and explanation
Correct answer: C
The gap between operating margin and pretax margin measures net nonoperating expense, chiefly interest, as a share of revenue. That gap widens from 2% to 6% of revenue and absorbs the whole 4-point gain in operating margin, so pretax and net margins stay flat.
Each cost layer as % of revenue:
| Layer | Formula | Yr 1 | Yr 2 | Yr 3 |
|---|---|---|---|---|
| COGS | 100% − gross margin | 70% | 68% | 66% |
| Operating expenses | gross − operating margin | 9% | 9% | 9% |
| Nonoperating expense | operating − pretax margin | 2% | 4% | 6% |
| Income tax | pretax − net margin | 5% | 5% | 5% |
Effective tax rate in every year.
Only the nonoperating layer grows (+4 points), offsetting the +4-point improvement in gross (and operating) margin.
Why the other options are wrong
- A. Operating expenses below gross profit (the gross-minus-operating-margin gap) are a constant 9% of revenue in all three years, so the operating margin rises one-for-one with the gross margin.
- B. The pretax-minus-net-margin gap is a constant 5% of revenue, and the effective tax rate is unchanged at about 26.3% of pretax income. Taxes do not explain the flat net margin.
Key takeaway Subtract adjacent margins to isolate each cost layer. Gross minus operating margin gives operating expenses; operating minus pretax margin gives nonoperating items; pretax minus net margin gives taxes.
This reading has 152 questions in the full bank. Practice all of them.
Key Takeaways
- Cash received in advance is a liability, unearned revenue. It becomes revenue only as the goods or services are delivered.
- With rising prices, FIFO gives the lowest COGS and the highest margins, LIFO the highest COGS and the lowest margins, and average cost falls in between. Sales are unaffected by the choice.
- Unusual or infrequent items: pre-tax, inside continuing operations. Discontinued operations: net of tax, below continuing operations, with prior periods restated. Analysts usually exclude discontinued operations when forecasting earnings.
- Basic EPS denominator excludes convertibles; stock dividends are retroactive; new issues are time-weighted.
- Subtract adjacent margins to isolate each cost layer. Gross minus operating margin gives operating expenses; operating minus pretax margin gives nonoperating items; pretax minus net margin gives taxes.