Financial Statement Analysis · Reading 37
Dupont Analysis
CFA Level I · Financial Statement Analysis · Reading 37: Financial Analysis Techniques · about 1 h 32 min
What you'll learn
- LOS 37.a Describe the tools and techniques of financial analysis (ratio, common-size, graphical and regression analysis) and their uses and limitations.
- LOS 37.b Calculate and interpret activity, liquidity, solvency and profitability ratios.
- LOS 37.c Describe relationships among ratios and evaluate a company using ratio analysis.
- LOS 37.d Apply DuPont analysis to decompose return on equity and interpret the effects of changes in its components.
- LOS 37.e Describe the uses of industry-specific ratios, including ratios for financial institutions and measures of business risk.
- LOS 37.f Describe how ratio analysis and other techniques are used to model and forecast earnings.
Module 37.1
Introduction to Financial Ratios
This reading covers the tools of financial analysis, the activity, liquidity, solvency and profitability ratios and the relationships among them, DuPont analysis of return on equity, industry-specific ratios, and the use of ratios in modeling and forecasting. A candidate must be able to calculate and interpret each ratio, decompose ROE into three or five parts, and judge a company's position from a set of ratios.
LOS 37.a — Tools and techniques of financial analysis
Raw financial statement numbers are hard to compare. A large firm has larger receivables, larger debt and larger profits than a small one simply because of its size. Step 3 of the financial statement analysis framework therefore converts the (adjusted) data into comparable forms, such as ratios, common-size statements and graphs, and may add statistical work such as regression. The four tools are ratio analysis, common-size analysis, graphical analysis and regression analysis.
Uses of ratio analysis
A ratio relates one statement item to another (for example, net income to revenue), which removes the effect of size. Ratios are most useful for raising questions that the analyst then investigates; a ratio seldom answers a question by itself. Ratios help an analyst to:
- forecast future earnings and cash flow;
- judge the firm's flexibility, meaning its ability to grow and to meet obligations when something unexpected happens;
- rate how well management has performed;
- track how the firm and its industry change over time;
- compare the firm with its industry competitors.
Comparisons run in two directions. Cross-sectional analysis compares a firm's ratios with those of other firms (peers, industry averages) for the same period. Time-series analysis (trend analysis) compares a firm's ratios with its own past values.
Limitations of ratio analysis
- A ratio viewed in isolation says little. It is informative only against peers or the firm's own history.
- Different accounting treatments (methods, estimates, IFRS versus US GAAP) distort comparisons, so the analyst may need to adjust the data first.
- Comparable industry ratios are hard to find for a company that operates in multiple industries (a conglomerate).
- No conclusion should rest on a single ratio; ratios must be read together.
- Deciding on the target or comparison value takes judgment. The benchmark is usually a range of acceptable values rather than one number.
- Ratios must be read in context: prior results, stated strategy, analyst expectations, the stage of the business cycle and peers.
- Definitions vary between analysts and data providers (for example, total liabilities versus interest-bearing debt in leverage ratios). What matters is using a definition consistently and knowing how published ratios were built.
- Reasonable values differ across industries. A grocer's asset turnover, for example, is far higher than a utility's.
Common-size analysis
Common-size statements express every line item relative to a common base so that firms of different size, or one firm across years, can be compared.
Key concept
| Format | Base (divisor) | Typical use |
|---|---|---|
| Vertical common-size income statement | Revenue (sales) of the same year | Trends in costs and margins |
| Vertical common-size balance sheet | Total assets of the same date | Asset mix and financing mix |
| Horizontal common-size statement | Each item's own value in a base year (set to 1.0 or 100%) | Growth of each item over time |
Every income statement line is divided by revenue, so a vertical common-size income statement shows the gross profit margin, operating profit margin and net profit margin directly. It also shows which cost lines drive a change in margin. A vertical common-size balance sheet shows ratios such as long-term debt to total assets at a glance.
Example. Kestrel Outfitters reports revenue of $640, cost of goods sold of $416, SG&A of $128 and net income of $48. Vertically, COGS is of revenue, gross margin is , SG&A is and the net profit margin is . Horizontally, if inventory was $90 in the base year and $117 two years later, it is shown as , a 30% increase since the base year.
Check the column order in any exhibit: some put the most recent year on the left, others on the right.
Graphical analysis
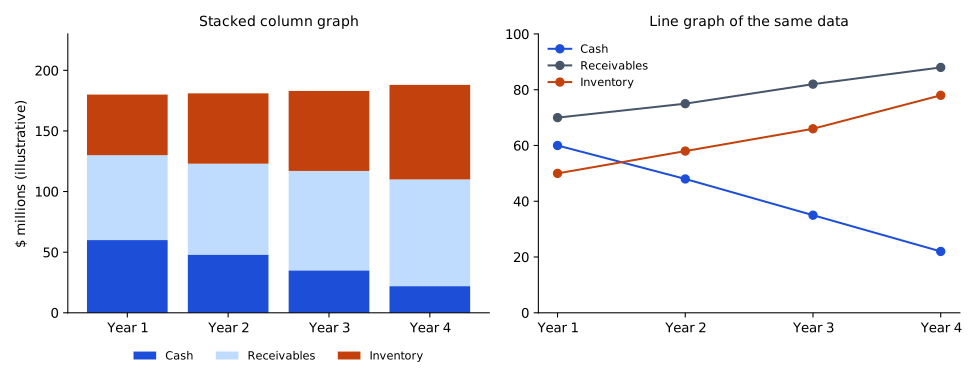
Graphs present comparisons and the composition of statement items over time. A stacked column graph (also called a stacked bar graph) shows how each component, such as cash, receivables or inventory, contributes to a total in each year. A line graph plots the same items as lines and makes trends easy to see, for example rising trade payables together with falling cash, which is a possible liquidity warning.
Regression analysis
Regression analysis identifies relationships between variables and is mainly used for forecasting. An analyst might, for example, estimate next year's sales from the historical relationship between the firm's sales and GDP.
Common exam traps
- A vertical common-size statement divides income statement items by sales and balance sheet items by total assets. Dividing by a base-year value is the horizontal format.
- Common-size analysis is a way of scaling the data, not a type of comparison. Setting a firm's ratios beside its rivals' ratios for the same year is cross-sectional analysis whatever scaling is used.
- "Calculating ratios is highly subjective" is not a valid limitation. The formulas are mechanical; judgment enters when the comparison value is chosen and the result interpreted.
Bottom line
- Financial analysis uses four tools: ratios, common-size statements, graphs and regression.
- Cross-sectional analysis compares a firm's ratios with those of other firms for the same period, while time-series analysis compares them with the firm's own past values.
- Ratios are informative only against peers or the firm's history, they are distorted by different accounting treatments, comparable industry ratios are hard to find for a conglomerate, and no conclusion should rest on a single ratio.
- A vertical common-size income statement divides each line by revenue and a vertical common-size balance sheet divides each line by total assets, while a horizontal common-size statement divides each item by its own base-year value.
- Regression analysis identifies relationships between variables and is mainly used for forecasting.
Quick check
Leon Varga places this year's gross profit margin, inventory turnover, and debt-to-equity ratio for Pallister Grocers next to the same ratios, for the same year, of four rival supermarket chains. Varga's approach is best described as:
Show answer and explanation
Correct answer: A
Setting a firm's ratios beside the same ratios of rival firms (or an industry average) for the same period is cross-sectional analysis. It shows how the firm performs relative to peers.
Why the other options are wrong
- B. Time-series analysis compares the same company's ratios across several periods, not across different firms in one period.
- C. Common-size analysis restates line items as percentages of a base (sales, total assets, or a base year). Varga is comparing ratios across firms, which is a different exercise.
Key takeaway Comparing several firms at one date is cross-sectional analysis. Following one firm across dates is time-series analysis.
Module 37.2
Financial Ratios, Part 1
LOS 37.b — Activity, liquidity, solvency and profitability ratios
Ratios are grouped by the question they answer. The groups overlap: payables turnover, for example, is an activity ratio that also says something about liquidity.
Key concept
| Category | Question it answers | Examples |
|---|---|---|
| Activity ratios (asset utilization, operating efficiency, turnover ratios) | How efficiently does the firm use its assets? | receivables, inventory, payables, total asset, fixed asset and working capital turnover; the "days" ratios |
| Liquidity ratios | Can the firm pay its short-term obligations as they come due? | current, quick and cash ratios; defensive interval; cash conversion cycle |
| Solvency ratios | Can the firm meet its long-term obligations; how much financial leverage does it use? | debt-to-equity, debt-to-capital, debt-to-assets, financial leverage, interest coverage, fixed charge coverage |
| Profitability ratios | How well does the firm turn sales, assets and equity into profit? | gross, operating and net profit margins; pretax margin; ROA; operating ROA; ROIC; ROE |
When a ratio combines an income statement flow with a balance sheet stock, it usually uses the average balance (beginning plus ending, divided by 2), unless a question specifies year-end figures. For seasonal businesses, averages of more data points (for example, quarterly) are better.
Activity ratios
Many analysts put purchases in the numerator of payables turnover instead of COGS, because payables arise from purchases. Purchases are rarely reported as a line item, but the inventory relationship gives them:
When a question gives purchases, use them; otherwise use COGS.
DSO is also called the average collection period, DOH the average inventory processing period, and days of payables the payables payment period. For quarterly turnover ratios, the days in the quarter replace 365.
Interpretation:
- A high receivables turnover points to efficient credit and collection. It can also reflect strict credit terms, a large discount for early payment or heavy penalties for late payment, and credit terms that are too strict cost sales. Comparing revenue growth with peers shows which: slower growth suggests terms are too tight, while growth at or above the peer average suggests good credit management.
- Inventory turnover uses COGS, not sales. Inventory is carried at cost and COGS is also measured at cost, while revenue includes the markup and would overstate how often inventory turns over. A high value suggests good inventory management, or stock levels so low that sales are lost. A low value may indicate obsolete, slow-moving inventory.
- A high payables turnover means the firm pays quickly, perhaps without using supplier credit fully or in order to take early-payment discounts. A low value may signal cash-flow trouble or simply lenient supplier terms; liquidity ratios help decide.
- Total asset turnover differs greatly by industry, from around 1 for capital-intensive manufacturers to around 10 for some retailers, so it is judged against the industry norm. A value that is too low means too much capital is tied up in assets; a value that is too high suggests too few assets for potential sales, or an outdated asset base.
- Fixed asset turnover uses net fixed assets (net of accumulated depreciation), so firms with more recently acquired assets typically show lower turnover and firms with older, heavily depreciated assets show higher turnover. A low value suggests too much capital in fixed assets or inefficient use of them; a very high value may point to obsolete equipment or to capital spending that will soon be needed to support growing revenue.
- Working capital turnover shows revenue generated per dollar of working capital. When payables are as large as inventory and receivables combined, working capital is close to zero and the ratio becomes very large, unstable from period to period and less informative about efficiency.
Liquidity ratios
Key concept
- The three balance sheet ratios differ only in which current assets they treat as available. The quick ratio (acid-test ratio) excludes inventory and other less-liquid current assets such as prepaid expenses. The cash ratio also excludes receivables. Higher values mean more liquidity. A current ratio below 1 means negative working capital (current assets − current liabilities), which usually signals liquidity trouble.
- The defensive interval ratio is the number of days the firm could pay its cash expenses from liquid assets alone. Expenditures are cash costs (COGS, SG&A, R&D). When they are estimated from income statement expense lines, noncash charges included in those lines, such as depreciation and amortization, are subtracted. Reported expenses of 100 that include depreciation of 20 mean cash expenditures of 80. Depreciation is added back only when the starting point is net income, as in the indirect-method cash flow statement.
- The cash conversion cycle (net operating cycle) is the time between paying suppliers and collecting from customers. DOH + DSO, the time from acquiring inventory to collecting cash for it, is the operating cycle; the cash conversion cycle subtracts the days of supplier credit from it. A long cycle ties up capital and may require short-term financing. A firm that collects before it pays (a negative cycle) can operate with a current ratio below 1.
Effect of transactions on a liquidity ratio. Consider a ratio with a positive numerator and denominator. If it is above 1, an equal decrease in numerator and denominator (for example, paying payables with cash) raises it, and an equal increase lowers it. If the ratio is below 1, the effects are reversed. Equal increases therefore pull the ratio toward 1, and equal decreases push it away from 1. Moving value between two items inside the numerator, such as collecting receivables into cash, leaves the current ratio unchanged but raises the cash ratio.
Solvency ratios
Here total debt means interest-bearing short-term and long-term debt, including the current portion of long-term debt. Exam convention: unless told otherwise, lease liabilities are left out of total debt. Current practice: lease liabilities bear interest and are recognized on the balance sheet under IFRS 16 and ASC 842, and many analysts and rating agencies include them in debt. Leaving them out makes leverage look low in lease-heavy industries such as airlines. Some analysts also count trade payables and other non-interest-bearing current liabilities as debt, while others subtract cash, cash equivalents and marketable securities to get net debt.
Key concept
Higher debt ratios mean more reliance on debt. The financial leverage ratio is also called the equity multiplier.
Profitability ratios
Operating profit (gross profit − SG&A and other operating costs) is usually approximated by earnings before interest and taxes (EBIT). Earnings before taxes (EBT) equals EBIT − interest, and gross profit equals revenue − COGS. Ratios that compare sales, at the top of the income statement, with a profit figure further down are operating profitability ratios; each margin isolates a different group of costs.
| Income statement line | Margin that uses it (÷ revenue) |
|---|---|
| Revenue | — |
| − Cost of goods sold | |
| = Gross profit | Gross profit margin |
| − Operating expenses (SG&A and other) | |
| = Operating profit (approximated by EBIT) | Operating profit margin |
| − Interest expense | |
| = Earnings before taxes (EBT) | Pretax margin |
| − Income taxes | |
| = Net income | Net profit margin |
| − Preferred dividends | |
| = Income available to common shareholders | (Used in return on common equity) |
Example. Pellworth Hardware has revenue of $900, COGS of $540, operating expenses of $198, interest expense of $27 and a 25% tax rate. Average receivables are $75 and average inventory is $90. Gross margin is . EBIT is , so the operating margin is . EBT is and net income , a net margin of . Interest coverage is . Receivables turnover is , giving a DSO of days, and inventory turnover is , giving a DOH of days.
Worked example: cash conversion cycle and defensive interval
A distributor reports revenue of $7,300, COGS of $4,380 and SG&A of $1,095; the expense lines include depreciation of $365. Average receivables are $600, average inventory $720 and average trade payables $420. At year-end it holds cash of $150, marketable securities of $90 and receivables of $600. Using COGS for payables turnover and a 365-day year, find the operating cycle, the cash conversion cycle and the defensive interval.
Step 1. Receivables turnover , so DSO days.
Step 2. Inventory turnover , so DOH days.
Step 3. Payables turnover , so days of payables days.
Step 4. Operating cycle days; cash conversion cycle days.
Step 5. Average daily expenditures . The depreciation is subtracted because it is a noncash charge inside the expense lines.
Result. Defensive interval days. Inventory is left out of the numerator.
Common exam traps
- Receivables turnover uses revenue, not COGS, because receivables are recorded at selling prices. Days ratios are 365 ÷ turnover, so the turnover itself is not a number of days. For Pellworth, using COGS gives a turnover of 7.2 and a DSO of 50.7 days instead of 12 and 30.4 days.
- In the cash conversion cycle, days of payables are subtracted.
- Inventory is not in the numerator of the defensive interval.
- Marketable securities stay in the quick ratio and in the cash ratio.
- Interest coverage uses EBIT. EBT and net income are the wrong numerators. For Pellworth, EBT gives 5.0 and net income gives 3.75 instead of 6.0.
- When only common-size percentages are given, convert them to amounts (percentage × total assets or × sales) before combining items from different statements.
Exam shortcuts
- For a ratio with a positive numerator and denominator, an equal decrease in both raises the ratio if it is above 1 and lowers it if it is below 1, and an equal increase does the opposite, so paying payables with cash raises a current ratio that is above 1.
- Collecting receivables into cash moves value inside the numerator of the current ratio, so the current ratio is unchanged while the cash ratio rises.
Bottom line
- Receivables turnover is revenue divided by average receivables, inventory turnover is COGS divided by average inventory, payables turnover is COGS (or purchases) divided by average trade payables, and each days ratio is 365 divided by the turnover.
- The cash conversion cycle equals DSO + DOH − days of payables, and the operating cycle equals DOH + DSO.
- The defensive interval equals cash, marketable securities and receivables divided by average daily cash expenditures, from which noncash charges in the expense lines are removed.
- Interest coverage is EBIT divided by interest payments, and fixed charge coverage is (EBIT + lease payments) divided by (interest payments + lease payments).
- Exam convention: total debt is interest-bearing short- and long-term debt with lease liabilities left out unless stated otherwise. Current practice: lease liabilities are on the balance sheet under IFRS 16 and ASC 842, and many analysts and rating agencies include them in debt.
- ROA is net income divided by average total assets, adjusted ROA adds interest expense × (1 − tax rate) to the numerator, and ROE is net income divided by average total equity.
Quick check
An analyst notes that the inventory turnover of Fenmore Outdoor dropped sharply this year, although its sales and cost of goods sold were roughly unchanged. Which explanation is most consistent with the decline?
Show answer and explanation
Correct answer: B
Inventory turnover is cost of goods sold divided by average inventory. With cost of goods sold roughly unchanged, a sharp fall in turnover means that average inventory rose. Duplicate orders add surplus stock, which increases average inventory and lowers turnover.
Why the other options are wrong
- A. A write-down at the start of the year reduces the carrying amount of inventory for the whole year. Average inventory is lower, so turnover rises.
- C. A just-in-time system is designed to keep inventory low. Lower average inventory raises turnover.
Key takeaway . Low turnover relative to peers can signal slow-moving or obsolete stock; high turnover can mean efficient management or inventory kept too low to meet demand, so compare revenue growth with peers before concluding.
Module 37.3
Financial Ratios, Part 2
LOS 37.b — Solvency and profitability ratios: interpretation details
The formulas are in Module 37.2. This module adds interpretation points and then turns to reading ratios together (LOS 37.c).
Solvency.
- A financial leverage ratio close to 1 means the assets are financed mostly with equity; the further it rises above 1, the more debt is used, which typically raises risk for both shareholders and bondholders. If "debt" is taken as all liabilities, .
- The lower interest coverage is, the harder it is to meet interest payments. Debt-to-EBITDA indicates roughly how many years of operating cash flow, with EBITDA as a proxy, would be needed to repay the debt.
- Fixed charge coverage is the more meaningful measure for firms that lease many of their assets, such as some airlines. It is also useful for US GAAP reporters with operating leases, because an operating lease records a single lease cost and no interest expense in the income statement, so interest coverage alone misses the lease burden. Because lease payments are added to both the numerator and the denominator, they pull the ratio toward 1. When interest coverage is above 1 (the normal case), fixed charge coverage is lower than interest coverage, and the gap widens as lease payments grow. The two are equal at 1. If interest coverage is below 1, fixed charge coverage is higher; with EBIT of 5, interest of 10 and leases of 10, it is against interest coverage of .
- Firms with stable cash flows can carry more debt, so solvency ratios are judged against cash-flow variability.
Profitability.
- The net profit margin should be based on income from continuing operations, because discontinued operations will not recur.
- The gross profit margin rises with higher prices or lower production costs. Competition limits pricing.
- The EBIT used for the operating profit margin can include some nonoperating items, and some analysts add back depreciation and amortization to use EBITDA. Whichever measure is chosen should be used consistently.
- The adjusted ROA adds back after-tax interest, so the numerator reflects returns to both debt and equity holders. The add-back uses gross interest expense, because lenders earn the full interest; interest income is not netted against it.
- Return on invested capital (ROIC) is after-tax operating profit ÷ average long-term capital, where long-term capital is long-term (interest-bearing) debt + preferred equity + common equity. Exam convention: long-term capital excludes working capital, meaning non-interest-bearing current liabilities such as accounts payable are not counted as capital. Current practice: invested capital is usually total interest-bearing debt, including short-term borrowings and debt due within one year, plus equity, often net of excess cash. Analysts should be concerned if ROIC is too low.
- ROE (return on total equity) uses total equity including preferred stock. Return on common equity removes preferred dividends from the numerator and preferred equity from the denominator.
LOS 37.c — Relationships among ratios and evaluating a company
No single ratio tells the story. An analyst compares each ratio with the firm's history (time-series) and with peers (cross-sectional), then asks which combination of changes explains the picture.
Useful relationships
Key concept
| Observation | Likely explanation to test |
|---|---|
| Current ratio rising while quick ratio falls | Inventory building up (check days of inventory on hand) |
| DSO falling while DOH rising | Faster collections may be offsetting a cash drain from slow-moving inventory |
| ROE rising while net margin and asset turnover fall | Higher financial leverage: more risk, not better operations |
| ROA falling but ROE rising | Leverage has increased () |
| Gross margin rising but net margin falling | Costs below gross profit (operating costs, interest, taxes) grew faster than sales |
| Interest coverage far below a peer's | Higher financial risk, even if margins are similar |
Higher is not always better. Values should be close to the industry norm. An activity ratio far better than the norm, such as a collection period well below the industry's, is a question to investigate rather than a sure strength; the possible explanations for each turnover ratio are in Module 37.2. Because DSO , a turnover below the industry average implies a collection period longer than the industry's.
Liquidity signals. Better liquidity shows up as higher current, quick and cash ratios and as faster conversion of receivables and inventory into cash (higher turnovers, shorter days). A lower balance of trade payables is ambiguous: it may reflect strong liquidity or suppliers demanding cash on delivery.
Example. Three years of data for Ferrand Glass:
| Year 1 | Year 2 | Year 3 | |
|---|---|---|---|
| ROA | 9.5% | 8.5% | 7.5% |
| Average liabilities / average equity | 0.90 | 1.40 | 2.00 |
| Net profit margin | 6.0% | 5.5% | 5.0% |
ROE : Year 1 ; Year 2 ; Year 3 . ROE improved even though ROA and margins deteriorated. The gain comes entirely from more leverage, so shareholders face more risk.
Evaluating a company against its industry. Each group of ratios is read in turn: liquidity (current ratio above or below the industry's), efficiency (asset turnover), profitability (margins, ROE) and leverage (debt ratios). A firm with a higher current ratio, lower margins and ROE, and a lower debt-to-capital ratio than its industry, for instance, is more liquid, less profitable and less leveraged than its peers.
Common exam traps
- A firm whose margins and ROE are below the industry's is less profitable, even if its coverage ratio is higher. The higher coverage indicates lower financial risk.
- When comparing interest coverage between firms, compute both ratios before judging how much lower one is than the other.
Exam shortcuts
- When interest coverage is above 1, fixed charge coverage is lower than interest coverage, because adding lease payments to both numerator and denominator pulls the ratio toward 1.
Bottom line
- A financial leverage ratio close to 1 means assets are financed mostly with equity, and if all liabilities are counted as debt, A/E = 1 + L/E.
- Fixed charge coverage is the more meaningful coverage measure for firms that lease many of their assets.
- Income from continuing operations is the right basis for the net profit margin, because discontinued operations will not recur.
- ROE uses total equity including preferred stock, while return on common equity removes preferred dividends from the numerator and preferred equity from the denominator.
- ROE rising while net margin and asset turnover fall, or ROA falling while ROE rises, points to higher financial leverage and more risk rather than better operations.
- Ratios should be close to the industry norm, so an activity ratio far better than the norm is a question to investigate rather than a sure strength.
Module 37.4
DuPont Analysis
LOS 37.d — DuPont analysis of return on equity
DuPont analysis breaks return on equity (ROE) into component ratios so the analyst can see why ROE is high, low or changing. It decomposes ROE; it is not a different way to measure it. When net income and equity are known, ROE is simply one divided by the other. Average or year-end equity can be used, as long as the choice is consistent.
Two-part decomposition
Original (three-part) DuPont equation
Multiplying ROA by revenue/revenue splits it into margin and turnover:
Key concept
The third term is the financial leverage ratio (equity multiplier, or leverage ratio) from Module 37.2. A low ROE must come from a poor net profit margin, poor total asset turnover, too little leverage, or a mix of these. Because revenue/equity is equity turnover, ROE also equals net profit margin × equity turnover.
Extended (five-part) DuPont equation
The net profit margin is split into three pieces:
Key concept
- Tax burden = NI/EBT = . A lower ratio means heavier taxes; with positive pretax income, higher taxes reduce ROE.
- Interest burden = EBT/EBIT. More interest relative to EBIT lowers the ratio, which is a heavier interest burden.
- EBIT margin = EBIT/revenue. If operating income replaces EBIT, the term becomes the operating margin and the interest burden term also captures nonoperating income.
- Tax burden × interest burden × EBIT margin = net profit margin, so the five-part and three-part results must agree.
Leverage cuts both ways. Borrowing helps shareholders only when the assets it funds earn more than the debt costs. Higher leverage raises the equity multiplier but also raises interest expense, which lowers the interest burden ratio. ROE rises with leverage only if the multiplier effect outweighs the fall in the interest burden ratio. For a profitable firm (positive net income and positive equity), holding all other components constant, a higher asset turnover or a higher net profit margin raises ROE. The condition matters. With a net loss, a higher asset turnover makes ROE more negative, and with zero net income it leaves ROE unchanged.
Worked example
Example. Arbutus Freight reports revenue of $1,600, EBIT of $192, interest expense of $32, taxes of $40, average total assets of $1,280 and average total equity of $640.
- Net income ; EBT ; ROE .
- Three-part: .
- Five-part: .
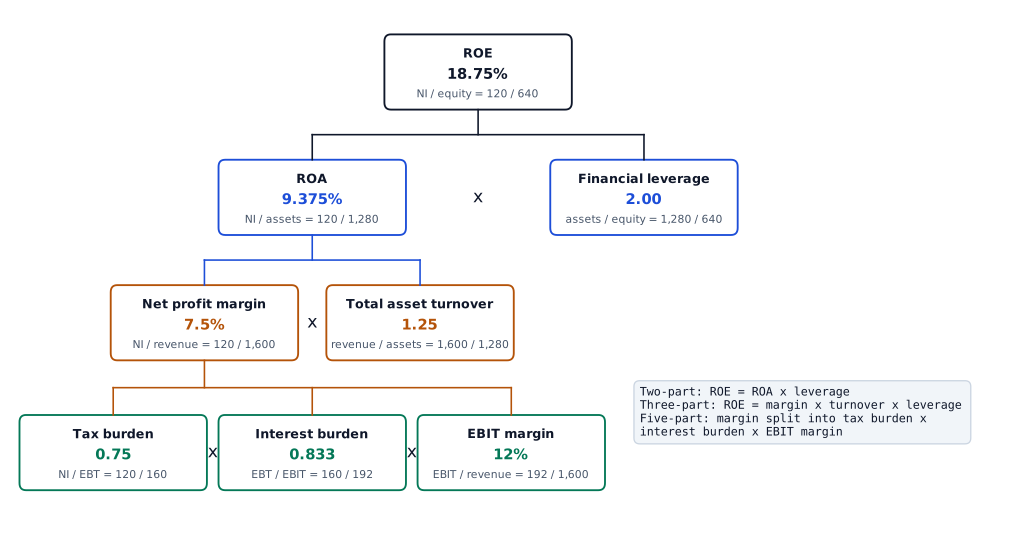
Comparing two firms. A firm can earn a higher ROE with less leverage if its EBIT margin and asset turnover are clearly better. The five-part decomposition shows whether tax, interest, operating margin, efficiency or leverage explains the gap.
Solving for a missing component. Rearrange the identity. For example, net profit margin , then net income , and equity .
Example. Oriel Stores and Paxton Goods both earn an ROE of 12%. Oriel has revenue of $450, average total assets of $300 and average total liabilities of $120, so its average equity is $180. Paxton has revenue of $900, average total assets of $900 and average total liabilities of $600, so its average equity is $300.
- Oriel: asset turnover , leverage , net profit margin .
- Paxton: asset turnover , leverage , net profit margin .
The same ROE comes from different sources. Oriel earns it with a higher margin and faster turnover; Paxton relies on more leverage.
Common exam traps
- The three components are net profit margin, total asset turnover and the equity multiplier (assets/equity). Gross margin and debt-to-equity are not components.
- EBT/EBIT is the interest burden; NI/EBT is the tax burden.
- ROE divides by equity, and net income = EBIT − interest − taxes. For Arbutus, dividing by average total assets gives 9.375%, which is ROA, instead of an ROE of 18.75%.
- When a question gives beginning and ending balances, it expects average assets and average equity; year-end balances give a different answer.
Exam shortcuts
- Tax burden × interest burden × EBIT margin equals the net profit margin, so a missing component can be solved from the identity and the five-part and three-part results must agree.
Bottom line
- ROE equals ROA times financial leverage, where financial leverage is average total assets divided by average total equity.
- In the three-part DuPont equation, ROE is the product of net profit margin, asset turnover (revenue / average total assets) and the equity multiplier (average total assets / average total equity).
- The five-part DuPont equation is ROE = tax burden (NI/EBT) × interest burden (EBT/EBIT) × EBIT margin × total asset turnover × financial leverage.
- Higher leverage raises the equity multiplier but lowers the interest burden ratio, so ROE rises with leverage only if the multiplier effect outweighs the fall in the interest burden ratio.
- For a profitable firm with positive equity, holding the other components constant, a higher asset turnover or a higher net profit margin raises ROE; with a net loss, higher asset turnover makes ROE more negative.
Quick check
A company has positive net income and positive shareholders' equity. Holding its net profit margin and its equity multiplier constant, if the company improves its total asset turnover, its return on equity will:
Show answer and explanation
Correct answer: B
In the original DuPont equation, ROE is the product of net profit margin, total asset turnover and financial leverage. Because net income and equity are positive, the net profit margin and the equity multiplier are both positive, so with those two components fixed ROE moves in the same direction as asset turnover.
Why the other options are wrong
- A. Asset turnover enters ROE as a multiplier. With a positive margin and a positive equity multiplier held constant, a higher turnover cannot lower ROE. It would lower ROE only for a loss-making firm, which the stem rules out.
- C. The outcome is not ambiguous here: the other two components are held constant and are positive. The result would be indeterminate only without the positive-income premise (a zero margin leaves ROE unchanged; a negative margin makes ROE fall).
Key takeaway ROE = net profit margin × total asset turnover × financial leverage; for a profitable firm, raising any one component with the others fixed raises ROE.
Module 37.5
Industry-Specific Financial Ratios
LOS 37.e — Industry-specific ratios
Every industry has its own key performance indicators, so part of an analyst's skill is choosing the ratios that matter for the business being analyzed.
Key concept
| Industry | Ratio | What it shows |
|---|---|---|
| Service and consulting firms | Sales per employee, net income per employee | Productivity of the people who are the main "asset" |
| Retail, restaurants | Growth in same-store sales | Growth from existing locations only (excludes new openings): how well the firm attracts and keeps customers; a decline can mean new stores are taking customers from old ones |
| Retail | Sales per square foot | Productivity of selling space; useful for comparing retailers with each other |
| Hotels | Average daily rate = room revenue ÷ number of rooms sold | Pricing / profitability indicator |
| Hotels | Occupancy rate = rooms sold ÷ rooms available | Activity (utilization) indicator |
| Subscription services (e.g., streaming) | Average revenue per user | Monetization of the customer base |
| Lending institutions (banks) | Exam convention: net interest margin = interest income ÷ interest-earning assets. Current practice: net interest margin = net interest income (interest income − interest expense) ÷ average interest-earning assets. Exam questions follow the exam convention unless they name the current-practice definition. | Performance of the lending business |
Regulators often require financial institutions to keep certain ratios above minimums or below maximums:
- Capital adequacy is a monetary measure of the firm's operational and financial risk relative to its equity capital. Regulators monitor it so that the firm has a buffer to absorb losses and to limit contagion across the banking system.
- Value at risk (VaR) is a common measure of capital risk. It estimates the size of loss that the firm will exceed only a specified percentage of the time over a specified period. This minimum loss in the worst outcomes is equivalent to the maximum loss at the stated confidence level: a 5% one-month VaR is the minimum loss in the worst 5% of months, which is also the maximum loss with 95% confidence. VaR is not the worst possible loss, because larger losses can still occur.
- Reserve requirements set a minimum level of eligible reserves (such as balances at the central bank) relative to a bank's reservable liabilities. Exam convention: banks are subject to minimum reserve requirements. Current practice: some central banks now set the minimum at zero.
- A liquid asset requirement requires a bank's liquid assets to be at least a stated proportion of certain of its liabilities.
Business risk and the coefficient of variation
The standard deviations of revenue, operating income and net income measure how variable (uncertain) a firm's results are, but they grow with firm size. The coefficient of variation (CV) is the size-adjusted version:
Key concept
A CV is variation per unit of the item, so it says nothing about the level of sales or income. Comparing CVs over time or across peers helps assess business risk:
- The CV of sales measures revenue stability (sales risk).
- The CV of operating income combines sales risk with the cost structure (operating leverage), which together make up business risk. On its own it cannot show whose operating costs are more volatile, because it also depends on how large costs are relative to sales.
- The CV of net income adds the effect of financial leverage (interest), taxes and nonoperating items.
Example. Operating income of Delford Mills averaged $50 million with a standard deviation of $12 million, so its CV is . A peer averaging $200 million with a standard deviation of $36 million has a CV of 0.18. The peer's swings are larger in dollars but smaller in relative terms.
LOS 37.f — Ratio analysis in modeling and forecasting earnings
Pro forma (projected) statements start from a forecast of next-period revenue. Other items are then tied to revenue with ratios the analyst expects to hold:
- If COGS as a percentage of sales is expected to stay constant, the common-size COGS percentage is applied to forecast sales to get forecast COGS (and gross profit).
- Without information suggesting a change, the prior-period operating profit margin can be applied to forecast sales to estimate operating profit.
- Ratios can also be moved in a chosen direction when the analyst expects a change.
Expense items are forecast as percentages of sales, the base of the common-size income statement, and not as percentages of net income.
Instead of relying on single point estimates, the analyst can study the range of outcomes:
Key concept
| Technique | How it works |
|---|---|
| Sensitivity analysis | "What if" analysis: change one input at a time (e.g., sales growth of 3% instead of 5%) and observe the effect on the outcome |
| Scenario analysis | Specify a coherent set of values for several key variables at once (a scenario) and compute the outcome for each scenario |
| Simulation | Assign probability distributions to key variables; a computer draws values at random many times and produces a distribution of outcomes |
Example. Revenue of $80 million is forecast to grow 15%. COGS has been 55% of sales and the operating margin 12%. Forecast revenue is , COGS , gross profit and operating profit million.
Common exam traps
- Net interest margin is a ratio for lending institutions such as banks, not for insurers or subscription businesses. Exam convention: interest income ÷ interest-earning assets. Current practice: net interest income ÷ average interest-earning assets.
- CV = standard deviation ÷ mean, not mean ÷ standard deviation. For Delford, mean ÷ standard deviation gives 4.17 instead of a CV of 0.24.
- The CV of operating income relates to business risk. Financial risk comes from the capital structure, which operating income excludes.
Bottom line
- Growth in same-store sales excludes new openings; a hotel's average daily rate is room revenue divided by rooms sold, and its occupancy rate is rooms sold divided by rooms available.
- Exam convention: net interest margin is interest income divided by interest-earning assets. Current practice: it is net interest income divided by average interest-earning assets.
- Value at risk is the loss a firm will exceed only a specified percentage of the time over a specified period, and it is not the worst possible loss.
- The coefficient of variation is the standard deviation of an item divided by its mean; the CV of sales measures sales risk, the CV of operating income measures business risk, and the CV of net income adds financial leverage, taxes and nonoperating items.
- Pro forma statements start from forecast revenue and tie other items to it with ratios such as the common-size COGS percentage and the operating profit margin.
- Sensitivity analysis changes one input at a time, scenario analysis sets a coherent set of values for several variables at once, and simulation draws values from probability distributions many times.
Quick check
Carraway Outfitters reported sales of $200 million for 20X5 and expects sales to grow by 9.5% in 20X6. Cost of goods sold is expected to stay at 50% of sales, and management targets an average of 50 days of inventory on hand in 20X6. Using a 365-day year, Carraway's forecast average inventory for 20X6 is closest to:
Show answer and explanation
Correct answer: B
Forecast next year's sales, apply the common-size COGS percentage, and convert the target days of inventory on hand into an inventory balance: average inventory = COGS/365 × days of inventory on hand.
Why the other options are wrong
- A. $13.70 million ignores the expected 9.5% sales growth and uses 20X5 COGS of $100 million.
- C. $30.00 million applies the inventory days to sales instead of cost of goods sold.
Key takeaway Days of inventory on hand is based on COGS: inventory = (COGS ÷ 365) × DOH.
Practice Questions
An analyst wants to assess how well a manufacturer converts its sales into operating profits. Which of the following ratios is least likely to be one of the operating profitability ratios she would use?
Show answer and explanation
Correct answer: B
Sales divided by total assets is total asset turnover, an activity (operating efficiency) ratio that shows how effectively assets generate revenue. Operating profitability ratios compare a measure of profit with sales.
Why the other options are wrong
- A. Gross profit / net sales is the gross profit margin, a standard profitability ratio.
- C. Net income / net sales is the net profit margin, which is also a profitability ratio based on sales.
Key takeaway Profit ÷ sales is a profitability ratio (a margin). Sales ÷ assets is an activity ratio (a turnover).
This reading has 106 questions in the full bank. Practice all of them.
Key Takeaways
- Comparing several firms at one date is cross-sectional analysis. Following one firm across dates is time-series analysis.
- . Low turnover relative to peers can signal slow-moving or obsolete stock; high turnover can mean efficient management or inventory kept too low to meet demand, so compare revenue growth with peers before concluding.
- Profit ÷ sales is a profitability ratio (a margin). Sales ÷ assets is an activity ratio (a turnover).
- ROE = net profit margin × total asset turnover × financial leverage; for a profitable firm, raising any one component with the others fixed raises ROE.
- Days of inventory on hand is based on COGS: inventory = (COGS ÷ 365) × DOH.