Fixed Income · Reading 64
Credit Risk
CFA Level I · Fixed Income · Reading 64 · about 35 min
What you'll learn
- LOS 64.a Describe credit risk, the Cs of credit analysis, and how probability of default and loss given default combine into expected loss.
- LOS 64.b Describe how credit ratings are used and the limitations of relying on them.
- LOS 64.c Describe macroeconomic, market (liquidity) and issuer-specific factors that affect the level and volatility of yield spreads.
Module 64.1
Credit Risk
This reading defines credit risk and its components, explains what credit ratings do and do not tell an investor, and identifies what drives the level and volatility of yield spreads. A candidate must be able to compute expected loss and a fair credit spread from the probability of default and the recovery rate, split a yield spread into liquidity and credit parts, and estimate the price effect of a spread change.
LOS 64.a — Credit risk, probability of default and loss given default
Credit risk is the risk that a borrower does not make its promised interest or principal payments, which leaves fixed-income investors with a loss. A borrower that fails to service its debt is in default.
The Cs of credit analysis
Analysts sort the drivers of credit risk into two groups.
Key concept
| Bottom-up credit analysis (borrower-specific) | Top-down credit analysis (environment) |
|---|---|
| Capacity — the borrower's ability to make its debt payments on time (profitability, coverage, leverage) | Conditions — the general economic environment that affects every borrower's ability to pay |
| Capital — other resources that reduce the borrower's reliance on debt | Country — the geopolitical, legal and political setting that applies to the debt |
| Collateral — the value of assets pledged as security for the lender if the borrower defaults | Currency — exchange-rate moves that affect the ability to service foreign-currency debt |
| Covenants — the legal terms and conditions agreed between borrower and lenders in the bond issue | |
| Character — the borrower's integrity (for a company, its management) and commitment to pay |
Sources of repayment. At bottom, credit risk is the chance that the borrower's sources of repayment do not generate enough cash to service the debt.
| Borrower | Primary sources of repayment | Secondary sources | Credit risk rises with |
|---|---|---|---|
| Corporate issuer | Operating cash flows and investments. Secured debt also has the cash flows from the specific collateral pledged; unsecured debt has no such claim | Asset sales, divestitures of subsidiaries, new debt or equity | Weak economic and market conditions, stronger competition, low profitability, excessive debt |
| Sovereign | Taxes, tariffs and other fees | New borrowing, privatizations (sales of public assets) | A weak economy, political uncertainty, fiscal deficits, high debt relative to the size of the economy |
An issuer that is illiquid (unable to raise cash to pay now) is not necessarily insolvent (assets worth less than debt), yet an illiquid issuer can still default.
A cross-default clause makes a default on one bond a default on all issues; a pari passu clause makes bonds of the same type rank equally in default. With both clauses in place, a default on any unsecured issue gives all unsecured holders a claim on the issuer's general assets. Secured holders get a claim on the general assets and on their pledged collateral, so they suffer a credit loss only if the collateral is worth less than the pari passu secured debt it backs.
Measuring credit risk
- Probability of default (PD): the (usually annualized) probability that the borrower misses a payment of interest or principal.
- Loss given default (LGD): the loss suffered if default occurs, as a money amount or as a rate (LGD%).
- Recovery rate: the proportion of the claim investors recover after default.
- Loss severity: the proportion not recovered: .
- Expected exposure (exposure at default): the money amount the investor is owed (principal plus accrued interest) net of available collateral value.
The expected loss in money terms is , and the expected loss rate (per unit of exposure) is . Because expected loss is the compensation investors need for bearing default risk, the expected loss rate is used as an estimate of the fair credit spread (a rate, so no money amount enters):
Key concept
If the bond's actual spread over a risk-free benchmark is above this estimate, investors are more than fairly compensated; if it is below, they are under-compensated and should avoid the bond.
Exam convention: loss given default is often given as a rate (LGD%) and multiplied directly by the probability of default, which gives expected loss as a percentage. Current practice: LGD is stated either as a money amount or as a percentage of exposure at default, and the percentage form is the loss severity, .
Worked example. With a PD of 2% and a recovery rate of 60%, LGD% is 40% and expected loss . A bond trading at a spread of 1.10% more than covers this estimate.
Worked example (money terms). A bondholder is owed $5,000,000 of principal plus $100,000 of accrued interest, and collateral worth $1,500,000 is available to repay the claim.
- Expected exposure .
- With a 30% recovery rate, loss severity is 70%, so LGD .
- With an annual PD of 1.5%, expected loss a year.
What drives the inputs. PD depends on capacity metrics: high EBIT margin, high EBIT/interest coverage, low debt/EBITDA and high cash flow relative to debt all indicate a low PD. LGD depends on security and seniority: senior secured debt loses less in default than junior unsecured debt. Investment grade issuers have a lower PD than high-yield issuers (rating categories defined under LOS 64.b), but high-yield issuers often issue secured debt, so their LGD can be lower than that of an investment grade issuer's unsecured bonds. For unsecured investment grade debt the main worry is a rise in PD as the issuer's finances deteriorate.
Common exam traps
- Expected loss uses the loss severity, , not the recovery rate itself. A higher recovery rate lowers expected loss and spreads. In the first worked example, using the 60% recovery rate gives 1.20% instead of 0.80%.
- Yield volatility is an input to interest rate (price) risk. It plays no part in expected credit loss.
LOS 64.b — Uses and limitations of credit ratings
Credit rating agencies assign forward-looking ratings to issuers and to individual issues. Ratings are used to compare credit risk across issuers, industries and bond types; to track changing credit conditions and credit migration risk (the risk that a downgrade lowers a bond's value and triggers contractual clauses); and to satisfy regulatory, statutory or contractual rules. A credit-linked coupon, which rises when the issuer is downgraded (Reading 52), is one example of a contractual clause that a downgrade can trigger.
Key concept
| Scale (S&P and Fitch / Moody's) | Category |
|---|---|
| AAA/Aaa down to BBB−/Baa3 | Investment grade |
| BB+/Ba1 and below | Non-investment grade (high-yield, "junk") |
| D (S&P, Fitch); Moody's lowest category C | In default |
The full scale, notch by notch:
| Moody's | S&P | Fitch | Category |
|---|---|---|---|
| Aaa | AAA | AAA | Investment grade (highest rating) |
| Aa1, Aa2, Aa3 | AA+, AA, AA− | AA+, AA, AA− | Investment grade |
| A1, A2, A3 | A+, A, A− | A+, A, A− | Investment grade |
| Baa1, Baa2, Baa3 | BBB+, BBB, BBB− | BBB+, BBB, BBB− | Investment grade |
| Ba1, Ba2, Ba3 | BB+, BB, BB− | BB+, BB, BB− | Non-investment grade (high-yield) |
| B1, B2, B3 | B+, B, B− | B+, B, B− | Non-investment grade (high-yield) |
| Caa1, Caa2, Caa3 | CCC+, CCC, CCC− | CCC | Non-investment grade (high-yield) |
| Ca | CC | CC | Non-investment grade (high-yield) |
| C (also covers bonds in default) | C | C | Non-investment grade (high-yield) |
| (included in C) | D | D | In default |
Limitations of ratings
- Ratings lag market pricing. Spreads and prices move faster than ratings, and two bonds with an identical rating may still trade at different yields, since ratings focus on expected loss while distressed-debt prices focus on default timing and recoveries.
- Some risks are hard to assess: litigation, natural disasters, environmental events, acquisitions and debt-financed buybacks. Agencies may disagree, producing split ratings.
- Agencies make mistakes, e.g., subprime mortgage securities before 2008–2009, and sudden defaults after corporate fraud.
Investors should also carry out their own due diligence; those who correctly anticipate rating changes earn better results than those who trade only after a change is announced.
LOS 64.c — Factors that drive the level and volatility of yield spreads
Credit spread risk means the risk that yield spreads widen and prices of credit-risky bonds fall. For investment grade investors it is the main practical concern, because a sudden default is unlikely.
Macroeconomic factors
- Strong growth and high profits lower PD, so spreads narrow; a recession raises PD, so spreads widen.
- Investment grade spreads are lower than high-yield spreads (lower expected loss), and spreads usually rise with maturity because the probability of default grows over longer horizons. A credit spread curve plots credit spread against maturity, so it normally slopes upward.
- In a contraction, credit curves rise and flatten, and the high-yield curve may even invert. In an expansion, credit curves fall and steepen; they are lowest and steepest at the peak of the cycle.
- High-yield spreads are more dispersed across issuers and fluctuate more than investment grade spreads. In a crisis, investors sell risky assets and buy safe ones (flight to quality), so high-yield spreads can widen dramatically. Their bid–offer spreads widen more too, and the rise in risk aversion can spill over into wider bid–offer spreads on investment grade bonds.
- Why hold high-yield anyway: the larger spread, diversification (low or negative correlation with investment grade bonds), capital appreciation in recoveries, and, on some evidence, equity-like returns with lower volatility than equities.
- Other systematic factors that push spreads up: tighter regulation of dealers (higher cost of holding bond inventory), funding stresses that raise risk aversion, and heavy new issuance that is not matched by demand. Conversely, strong demand and light supply narrow spreads.
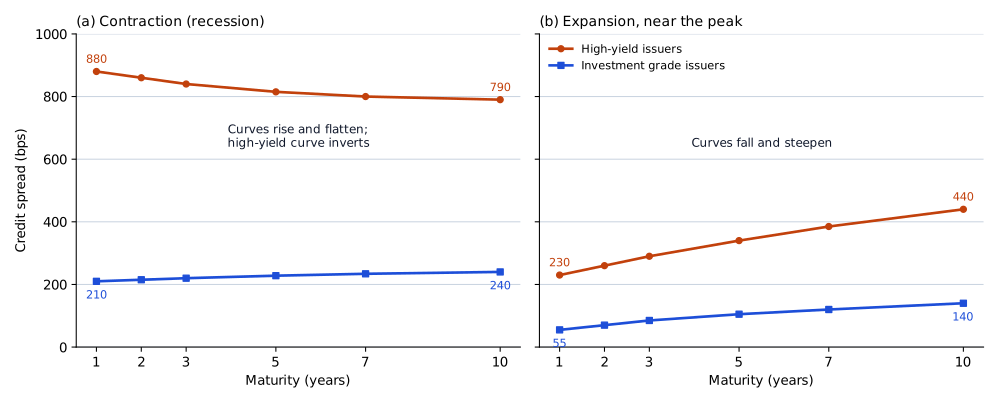
The figure sketches the credit spread curves of both rating groups in a contraction and near the peak of an expansion, with illustrative numbers.
Issuer-specific factors
An issuer with problems servicing its debt trades at a wider spread than the average for its rating; comparing an issuer's spread with its rating-category average highlights issuer-specific concerns.
Market factors: liquidity
Market liquidity risk is the risk that trading a bond is costly because the investor sells below (or buys above) the bond's fair midprice. It shows up in the dealers' bid–offer spread. It is higher for less actively traded bonds, lower-rated issuers and issuers with little debt outstanding. The two "spreads" differ: the yield spread is extra yield over the benchmark; the bid–offer spread is a price difference.
Splitting a yield spread. Compute the yield at the bid price and at the offer price; the difference is the liquidity spread, and the remainder of the yield spread is attributed to credit risk.
Worked example. A 5-year, 4% annual-coupon bond is quoted 99.00 bid / 99.80 offer; the benchmark yields 2.80%.
- At the mid price of 99.40 the yield is 4.135%, so the yield spread is about 1.335% (133.5 bp).
- Bid yield (P/Y = C/Y = 1, END mode):
N = 5; PV = −99.00; PMT = 4; FV = 100; CPT I/Y = 4.226. Offer yield, changing only the price:PV = −99.80; CPT I/Y = 4.045. - Liquidity spread , or 18.1 bp; credit component bp.
| Building block | Size | How it is found |
|---|---|---|
| Benchmark yield | 2.800% | yield on the government benchmark |
| 0.181% | yield at the bid price minus yield at the offer price |
| 1.154% | yield spread minus liquidity spread |
| = Yield spread | 1.335% | bond yield at the mid price minus benchmark yield |
| Bond yield | 4.135% | benchmark yield plus yield spread |
Price impact of a spread change. Duration and convexity apply to spread changes just as to yield changes:
E.g., ModDur 4.5, convexity 30, spread +40 bp: .
The formula can also be worked backward to find the spread change behind an observed price change. Start from the duration-only estimate, , then test candidate values in the full formula. In the example, a 1.776% price fall gives a duration-only estimate of , or 39.5 bp of widening. The convexity term cushions the fall, so the spread in fact widened by slightly more, 40 bp. For a price gain the error runs the other way: the duration-only estimate overstates how far the spread narrowed.
Because modified duration multiplies the spread change, a longer-duration bond loses more value than a shorter one for the same widening of its spread.
Common exam traps
- The liquidity spread is bid yield minus offer yield (the bid price is lower, so its yield is higher). Express it in the same units as the total spread before computing a share.
- An expected expansion, which narrows spreads, favors corporates over government bonds; an expected contraction favors government bonds.
- The convexity term is always added (positive for option-free bonds), whether spreads rise or fall. In the +40 bp example, subtracting it gives −1.824% instead of −1.776%.
Exam shortcuts
- Bid and offer yields come from the same TVM entries with only PV changed, so the second yield needs one new entry and one compute.
- For an option-free bond, with the benchmark yield and all other factors unchanged, back out a spread change from a price change by starting from ; for a price fall the true widening is slightly larger than this, and for a price gain the true narrowing is slightly smaller.
Bottom line
- Bottom-up credit analysis looks at the borrower's capacity, capital, collateral, covenants and character, and top-down analysis looks at conditions, country and currency.
- , where in money terms and the loss severity is .
- Exam convention: loss given default is often given as a rate (LGD%) and multiplied directly by the probability of default to give expected loss as a percentage; current practice states LGD as a money amount or as a percentage of exposure at default, the percentage form being the loss severity.
- The expected loss rate, , estimates the fair credit spread; an actual spread above it means investors are more than fairly compensated, and one below it means they are under-compensated.
- Ratings from AAA/Aaa down to BBB−/Baa3 are investment grade and ratings of BB+/Ba1 and below are non-investment grade (high-yield).
- Credit ratings lag market prices, struggle with risks such as litigation, natural disasters and debt-financed buybacks, and can be wrong, so ratings are no substitute for an investor's own due diligence.
- Spreads narrow when growth and profits are strong and widen in a recession; in a contraction credit curves rise and flatten, and in an expansion they fall and steepen.
- , and the liquidity spread inside a yield spread equals the yield at the bid price less the yield at the offer price.
Quick check
To judge how likely Morrow Chemicals is to default, an analyst calculates its EBIT margin, its EBIT-to-interest expense ratio, and its debt-to-EBITDA ratio. This analysis is most likely an evaluation of the company's:
Show answer and explanation
Correct answer: A
Capacity is the borrower's ability to make its debt payments on time. It is assessed with quantitative measures of profitability, coverage and leverage. A high EBIT margin, high interest coverage and low debt/EBITDA indicate strong capacity and a low probability of default.
Why the other options are wrong
- B. Collateral analysis looks at the value of the specific assets pledged as security rather than at the issuer's income and leverage ratios.
- C. Covenant analysis reviews the legal terms and conditions of the bond agreement.
Key takeaway Ratio analysis of profits, coverage and leverage assesses capacity; pledged assets are collateral; legal terms are covenants.
Practice Questions
The trustees of the Linwood Teachers' Pension Plan propose to select corporate bonds using agency credit ratings alone. Which of the following is a limitation of relying solely on credit ratings?
Show answer and explanation
Correct answer: B
Credit ratings lag market pricing. Spreads and prices react to new information quickly, while agencies revise ratings more slowly, so an investor who waits for a rating change often trades after the price has already moved. Two further limitations are that some risks, such as litigation, natural disasters, acquisitions or debt-financed share buybacks, are hard to capture in a rating, and that agencies make mistakes. Investors should therefore do their own credit analysis as well.
Why the other options are wrong
- A. The statement is false. Agencies assign issuer credit ratings and issue credit ratings, and an issue can be notched above or below its issuer's rating.
- C. Comparing credit risk across issuers, industries and bond types is a use of credit ratings. It does not describe a limitation.
Key takeaway Uses of ratings: comparing credit risk, tracking credit migration risk and meeting regulatory or contractual rules. Limitations: ratings lag market prices, some risks are hard to rate, and agencies can be wrong.
A portfolio manager at Corvel Asset Management expects the economy to move out of recession into a strong recovery over the coming year. Which change to her bond portfolio is most appropriate?
Show answer and explanation
Correct answer: A
In an economic expansion, profits rise and the probability of default falls, so corporate yield spreads narrow. Narrowing spreads mean corporate bond prices rise relative to government bond prices, so the manager should overweight corporates versus government bonds.
Why the other options are wrong
- B. This positioning profits when spreads widen, which is what happens when the economy weakens.
- C. Upgrading credit quality is a defensive move suited to an expected contraction; in a recovery the lower-rated bonds' spreads tend to narrow the most.
Key takeaway In an expansion spreads narrow, which favors credit (and lower quality); in a contraction spreads widen, which favors government and higher-quality bonds.
A corporate bond has a modified duration of 6.2 and a convexity of 52. If its credit spread widens by 60 basis points while benchmark yields are unchanged, the estimated percentage change in the bond's full price is closest to:
Show answer and explanation
Correct answer: A
Duration and convexity estimate the price effect of a spread change exactly as they do for a yield change, with the spread change replacing the yield change. The convexity adjustment is positive, so it makes the price decline slightly smaller than the duration-only estimate.
Why the other options are wrong
- B. −3.72% is the duration-only estimate; it omits the positive convexity adjustment.
- C. −3.81% subtracts the convexity adjustment instead of adding it.
Key takeaway The convexity term is always added for an option-free bond.
This reading has 20 questions in the full bank. Practice all of them.
Key Takeaways
- Ratio analysis of profits, coverage and leverage assesses capacity; pledged assets are collateral; legal terms are covenants.
- Uses of ratings: comparing credit risk, tracking credit migration risk and meeting regulatory or contractual rules. Limitations: ratings lag market prices, some risks are hard to rate, and agencies can be wrong.
- In an expansion spreads narrow, which favors credit (and lower quality); in a contraction spreads widen, which favors government and higher-quality bonds.
- The convexity term is always added for an option-free bond.