Fixed Income · Reading 59
The Term Structure of Interest Rates: Spot, Par, and Forward Curves
CFA Level I · Fixed Income · Reading 59 · about 25 min
What you'll learn
- LOS 59.a Define spot rates and the spot curve, and price a bond by discounting each cash flow at its own spot rate.
- LOS 59.b Define par and forward rates; compute par rates, forward rates from spot rates, spot rates from forward rates, and bond prices using forward rates.
- LOS 59.c Compare the spot curve, par curve and forward curve and how they are ordered in normal, inverted and flat environments.
Module 59.1
The Term Structure of Interest Rates: Spot, Par, and Forward Curves
This reading prices bonds with a separate spot rate for each cash flow and links spot rates, par rates and forward rates. A candidate must be able to price a bond from spot rates, compute par rates, derive forward rates from spot rates and spot rates from forward rates, price a bond with forward rates, and describe how the spot, par and forward curves relate.
LOS 59.a — Spot rates, the spot curve and pricing a bond with spot rates
A bond's yield to maturity (YTM) discounts every cash flow at one rate. In reality the market applies a different rate to each date. The market discount rate for a single payment at a future date is the spot rate for that maturity. Because a zero-coupon bond makes exactly one payment, its YTM is the spot rate for its maturity. For this reason spot rates are also called zero-coupon rates or zero rates. At a positive yield, all of a zero-coupon bond's return comes from price appreciation toward par; there are no coupons to reinvest.
The spot curve plots spot rates against time to maturity for one type of issuer (e.g., government spot rates). It usually slopes upward, a normal yield curve, because investors want higher returns for committing money over longer horizons. When longer-maturity spot rates are lower than shorter ones, the curve slopes downward and is called inverted.
Pricing with spot rates
Discount each cash flow at the spot rate that matches its own date and add the present values:
This is the no-arbitrage price (the arbitrage-free valuation approach). If a bond traded at any other price, a dealer could strip it into zero-coupon pieces (or rebuild it from zeros) and lock in a riskless profit. Absent arbitrage opportunities, the market price therefore equals this value whatever the shape of the curve. The difference between market price and no-arbitrage value is the potential arbitrage profit. A government bond is valued with the government spot rate for each cash flow's maturity; the same spot rate applies to a given date whichever bond the cash flow belongs to (the 6-year spot rate discounts the year-6 coupon of a 20-year bond too).
Example. Spot rates: , , . A 3-year, 4% annual-pay bond:
Its YTM (N = 3, PMT = 4, FV = 100, PV = −102.055, CPT I/Y) is 3.27%. It is a cash-flow-weighted blend of the spot rates, dominated by because most of the cash arrives at year 3. The YTM is found as the bond's internal rate of return; a simple or geometric average of spot rates does not give it.
Common exam traps
- Discounting every cash flow at the longest spot rate, or at the first one. For the 3-year, 4% bond in the example, discounting everything at 3.3% gives 101.969 and at 2.0% gives 105.768, instead of 102.055.
- Forgetting the final coupon (discounting only the principal at maturity). For the same bond, discounting only the 100 of principal at year 3 gives 98.426 instead of 102.055.
- Using annual spot rates with semiannual periods: for semiannual cash flows, use and count half-years.
LOS 59.b — Par rates, forward rates, and moving between spot and forward rates
Par rates
A par rate is the coupon rate that makes a bond of a given maturity price at exactly par, given the spot curve. Equivalently, it is the YTM of a hypothetical par bond. For maturity with coupon per 100:
With the spot rates above (2.0%, 2.8%, 3.3%), the 3-year par rate is 3.27%, slightly below the 3-year spot rate. On the exam it is often quicker to plug in the middle answer choice: a price below 100 means the par rate is higher; above 100 means it is lower.
Forward rates and notation
A forward rate is a rate agreed today for a loan that starts at a future date. The notation AyBy means a B-year loan starting A years from now: 1y1y is a 1-year rate one year from now, 2y1y a 1-year rate two years from now, 2y2y a 2-year rate two years from now.
No arbitrage requires that investing for N years at the N-year spot rate grows to the same amount as rolling over at the forward rates:
Key concept
The two-year case shows the logic. An investor who buys a 1-year zero at instead of a 2-year zero at a higher accepts less in year 1. That choice makes sense only if the rate available for year 2 is high enough to catch up. The forward rate 1y1y is the year-2 rate at which both plans end with the same amount.
Spot from forwards. The spot rate is the geometric mean of the one-period rates:
Forward from spots:
Key concept
Example. With , , :
- . The square root annualizes the 2-year forward rate.
- Going back: .
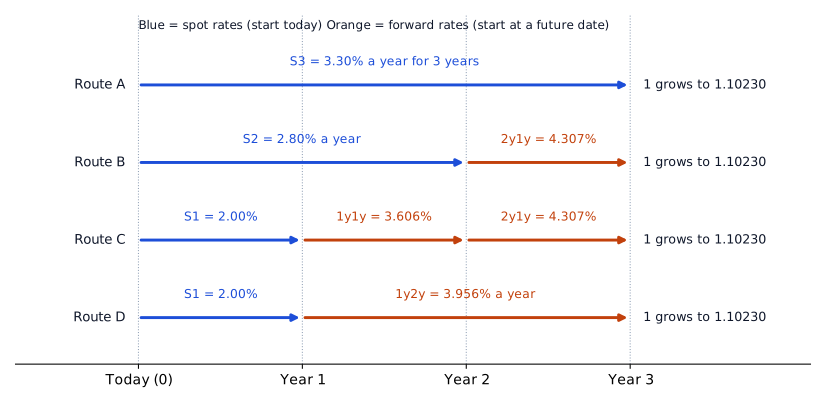
Each route in the figure turns 1 into 1.10230 by year 3, so any one rate on the timeline can be backed out from the others. A 1-year spot rate, for example, is .
Approximation check: forward ≈ difference of "total" rates, e.g. . Useful to screen answers; the exact figure uses compounding. The same shortcut works for a multi-year forward: .
Semiannual rates: with rates stated on a semiannual bond basis, work with half-year rates and periods, then double the result (e.g., the 6-month rate six months forward, ).
Worked example: a 6-month forward rate and a semiannual bond price
Spot rates on a semiannual bond basis are 2.3% for 6 months and 3.1% for 1 year. Compute the 6-month rate six months forward (6m6m) on a semiannual bond basis, and price a 1-year bond with a 4.4% coupon paid semiannually, per 100 of par.
Step 1. Half-year spot rates: and .
Step 2. Half-year forward rate: . On a semiannual bond basis, .
Step 3. The bond pays 2.2 after 6 months and 102.2 after 1 year. Price .
Result. The 6m6m forward rate is 3.903%, and the bond is worth 101.279 per 100 of par.
Valuing a bond with forward rates
Each cash flow is discounted by the product of one plus each one-period rate up to its date:
These products are the spot-rate discount factors, so the price is the same no-arbitrage price. Example: with rates 2%, 3% and 3.5% for years 1–3, a 3-year 4% bond is worth . A zero-coupon bond is priced the same way with only the final term.
Common exam traps
- Using the arithmetic average of forward rates instead of the geometric mean. The gap widens as the rates spread apart.
- Forgetting to annualize a multi-year forward rate (take the root), or dividing by B instead of taking the root. For 1y2y in the example, leaving out the root gives 8.069%, and dividing by 2 gives 4.034%, instead of 3.956%.
- Off-by-one exponents: the year-4 to year-5 forward uses .
- Discounting a later cash flow at only one forward rate instead of the compounded chain. With the 2%, 3% and 3.5% rates in the example, discounting each cash flow at its own year's rate alone gives 108.29 instead of 103.37.
LOS 59.c — Comparing the spot, par and forward curves
| Curve | What it plots | Observed or derived? |
|---|---|---|
| Spot curve (zero curve, strip curve) | Spot rates (YTMs of zero-coupon bonds) vs maturity | From zero-coupon or stripped Treasury prices |
| Yield curve for coupon bonds | YTMs of actively traded coupon bonds of the same or similar issuer vs maturity | Observed; gaps filled by linear interpolation |
| Par curve | Coupon rates at which bonds of each maturity would price at par | Derived (hypothetical) from the spot curve |
| Forward curve | Forward rates (e.g., 1-year rates) for successive future periods | Derived from spot rates |
A coupon-bond yield curve built from market prices suffers from illiquidity and from tax distortions for bonds trading away from par; using on-the-run issues helps with liquidity, but there may be too few of them. A par curve derived from the spot curve avoids these problems. Rates on these curves are usually quoted on a semiannual bond basis.
How the curves relate
Forward rates drive spot rates (a spot rate is a geometric mean of forwards), and spot rates drive par rates (a par rate is a weighted average of spot rates). The par rate is weighted most heavily toward the final cash flow.
Key concept
| Environment | Ordering |
|---|---|
| Normal (upward-sloping) | forward > spot > par beyond the first year; spot rises more slowly than forward; par just below spot |
| Inverted (downward-sloping) | forward < spot < par beyond the first year; par just above spot |
| Flat | forward = spot = par at all maturities |
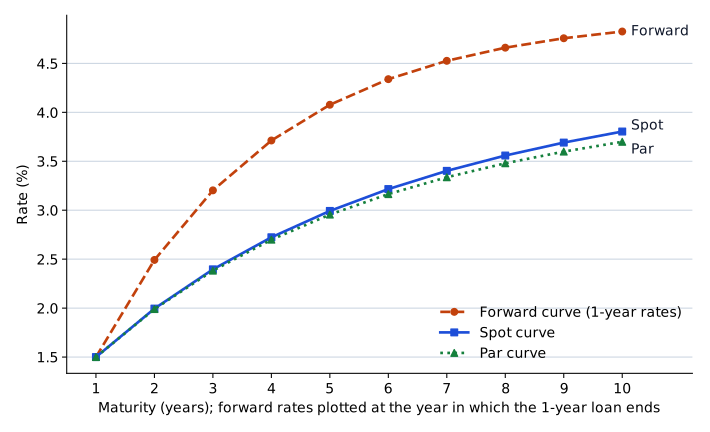
An inverted curve is consistent with the market expecting short-term rates to fall.
Common exam traps
- Saying the par curve is observed in the market. It is theoretical, derived from spot rates.
- Reversing the ordering in an inverted environment: there, par yields sit above spot rates and forwards are lowest.
- Confusing "the yield curve" of coupon bonds (same issuer, different maturities) with a plot across issuers.
Exam shortcuts
- A forward rate is roughly the difference of the total rates, for example ; the exact figure needs compounding, but the approximation screens out wrong answer choices quickly.
- To find a par rate from answer choices, plug in the middle choice: a price below 100 means the par rate is higher, and a price above 100 means it is lower.
Bottom line
- A spot rate is the market discount rate for a single payment at a future date, which is why it equals the YTM of a zero-coupon bond of that maturity.
- The no-arbitrage price of a bond discounts each cash flow at the spot rate for its own date, and the bond's YTM is the internal rate of return at that price, not a simple or geometric average of the spot rates.
- A par rate is the coupon rate at which a bond of a given maturity would be priced at par, given the spot curve.
- , where the root annualizes a multi-year forward rate.
- A spot rate is the geometric mean of the one-period rates up to its maturity: .
- Discounting each cash flow by the compounded chain of one-period forward rates up to its date gives the same no-arbitrage price as discounting at spot rates.
- Beyond the first year, forward > spot > par when the curve is normal (upward-sloping), forward < spot < par when it is inverted, and all three are equal when it is flat.
- The par curve and the forward curve are derived from the spot curve, while the yield curve for coupon bonds is observed from the YTMs of actively traded bonds, with gaps filled by linear interpolation.
Quick check
Which of the following statements about zero-coupon bonds and spot rates is most accurate?
Show answer and explanation
Correct answer: C
A zero-coupon bond pays no coupons: at a positive yield it is bought below par and pays par at maturity, so its entire return is price appreciation and there is no uncertainty about reinvesting coupons. Its yield to maturity is the spot rate for its maturity.
Why the other options are wrong
- A. The YTM of a zero-coupon bond is the spot rate for that maturity, so the 4-year spot rate is 5.2%; it is not divided by the number of years.
- B. Spot rates generally differ across maturities, and that variation is what the spot curve shows. Only in a flat environment are they all equal.
Key takeaway Zero-coupon bond: YTM = spot rate; at a positive yield the whole return is the price rising toward par; no reinvestment risk.
Practice Questions
Which of the following best describes how the arbitrage-free approach values an option-free bond?
Show answer and explanation
Correct answer: A
The arbitrage-free approach uses multiple discount rates: the spot rate for each cash-flow date, taken from the current term structure. Pricing this way leaves no profit from stripping the bond into zero-coupon pieces or rebuilding it from them.
Why the other options are wrong
- B. A geometric average of spot rates is still one rate for every cash flow; it does not apply the correct rate to each date.
- C. One discount rate for all cash flows is the yield-to-maturity approach, which is not how arbitrage-free values are derived.
Key takeaway Arbitrage-free valuation uses one spot rate per cash-flow date.
Government spot rates are 2.1% for one year, 2.9% for two years and 3.6% for three years (annual compounding). The coupon rate at which a 3-year annual-pay government bond would be priced at par (the 3-year par rate) is closest to:
Show answer and explanation
Correct answer: B
The par rate is the coupon that makes the spot-rate value of the bond equal to 100. It is a weighted average of the spot rates, dominated by the 3-year rate, so in an upward-sloping environment it lies just below the 3-year spot rate.
Discount factors: , , .
Check with the middle choice: .
Why the other options are wrong
- A. 2.87% is the simple average of the three spot rates; the par rate gives far more weight to the year-3 cash flow.
- C. 3.60% is the 3-year spot rate. A bond with a 3.60% coupon would price slightly above par (about 100.10), because its first two coupons are discounted at spot rates below 3.6%.
Key takeaway In a normal (upward-sloping) curve, par rates sit just below spot rates. Plugging in the middle answer choice is a fast exam check.
Current market rates (annual compounding) are as follows: the 1-year spot rate is 2.8%, the 1-year forward rate one year from now is 4.6%, and the 1-year forward rate two years from now is 6.2%. The price per 100 of par of a 3-year zero-coupon bond is closest to:
Show answer and explanation
Correct answer: B
A 3-year zero-coupon bond has one cash flow at year 3, so it is discounted at the 3-year spot rate, which is the geometric mean of the 1-year spot and the two forward rates. Equivalently, divide 100 by the product of the three growth factors.
Equivalently, ; TI BA II Plus (P/Y = C/Y = 1): N = 3, I/Y = 4.524, PMT = 0, FV = 100, CPT PV = −87.57.
Why the other options are wrong
- A. 92.05 discounts for three years at the 1-year spot rate of 2.8%, ignoring the higher forward rates for years 2 and 3.
- C. 83.49 discounts for three years at the 2y1y rate of 6.2%, as if the last year's rate applied to every year.
Key takeaway To discount a year-N cash flow with forward rates, divide by the product of all one-period factors up to year N.
The chart below shows the spot curve, the par curve and the forward curve of 1-year rates, all derived from the same set of government bond prices (annual compounding). The curves are labeled only X, Y and Z.
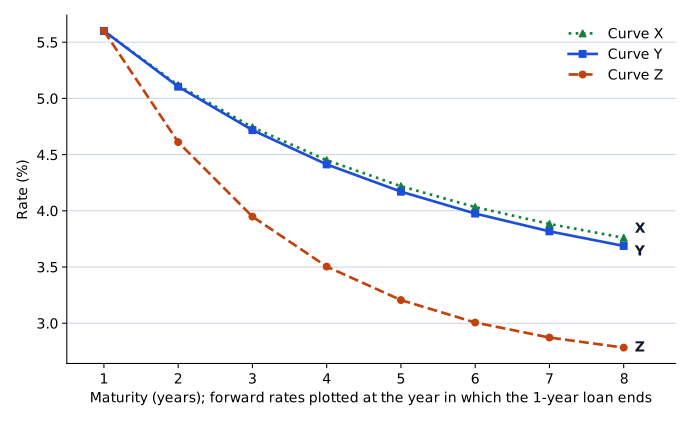
Curve X is most likely the:
Show answer and explanation
Correct answer: A
The chart shows a downward-sloping (inverted) environment. When forward rates decline with maturity, spot rates (geometric means of the forwards) decline more slowly, and par rates (weighted averages of spot rates) lie close to but slightly above the spot rates. The highest curve, X, is therefore the par curve; Y is the spot curve and Z the forward curve.
Why the other options are wrong
- B. The spot curve is Y: it lies just below the par curve in an inverted environment and above the forward curve.
- C. The forward curve is Z, the lowest and steepest curve: falling forward rates are what pull the spot and par curves down.
Key takeaway Normal curve: forward > spot > par. Inverted curve: forward < spot < par. Flat: all equal.
This reading has 41 questions in the full bank. Practice all of them.
Key Takeaways
- Zero-coupon bond: YTM = spot rate; at a positive yield the whole return is the price rising toward par; no reinvestment risk.
- Arbitrage-free valuation uses one spot rate per cash-flow date.
- In a normal (upward-sloping) curve, par rates sit just below spot rates. Plugging in the middle answer choice is a fast exam check.
- To discount a year-N cash flow with forward rates, divide by the product of all one-period factors up to year N.
- Normal curve: forward > spot > par. Inverted curve: forward < spot < par. Flat: all equal.