Corporate Finance · Reading 25
Modigliani Miller
CFA Level I · Corporate Finance · Reading 25: Capital Structure · about 43 min
What you'll learn
- LOS 25.a Calculate and interpret a company's weighted-average cost of capital using after-tax cost of debt and target (market) weights.
- LOS 25.b Explain internal, external and life-cycle factors that affect capital structure, debt capacity and the WACC.
- LOS 25.c Explain the Modigliani–Miller propositions on capital structure, without and with taxes, and the role of costs of financial distress.
- LOS 25.d Describe optimal and target capital structures: static trade-off theory, deviations from target, asymmetric information, agency costs and pecking order theory.
Module 25.1
Weighted-Average Cost of Capital
This reading calculates the weighted-average cost of capital and explains the internal and external factors, including the life cycle stage, that shape a company's capital structure. It then sets out the Modigliani–Miller propositions with and without taxes, the costs of financial distress, the static trade-off and pecking order theories, and how a target capital structure is estimated.
LOS 25.a — Calculating and interpreting the WACC
A company's weighted-average cost of capital (WACC) is the blended required return of all its capital providers. With debt and common equity only:
Key concept
where and are the weights of debt and equity (), is the pretax cost of debt, is the marginal tax rate, and is the cost of equity. If the firm has preferred stock, add . Preferred dividends are not tax-deductible, so this term has no tax adjustment.
Key points:
- Debt costs less than equity because debtholders are paid first from the firm's cash flows and have a senior claim on its assets.
- Interest is tax-deductible in most jurisdictions, so the pretax cost of debt is converted to an after-tax cost of debt, . The cost of equity gets no tax adjustment.
- The weights can be target weights or market value weights. Market values reflect conditions today, so they are the right basis for measuring today's opportunity cost of capital. LOS 25.d explains how an analyst estimates a target capital structure that the company does not disclose.
- The WACC is the discount rate for computing the NPV of an expansion that mirrors the existing business and is financed in the firm's normal proportions.
Example. A firm's debt has a market value of $32 million and its equity $48 million, so and . Its pretax cost of debt is 7%, its cost of equity is 12%, and its tax rate is 21%.
Common exam traps
- Forgetting the tax adjustment (using instead of ) overstates the WACC. In the example, instead of 9.41%.
- Multiplying by instead of understates it badly. In the example, instead of 9.41%.
- Swapping the weights, or weighting by the debt-to-equity ratio instead of by each source's share of total capital, and . In the example, swapping them gives instead of 9.41%.
LOS 25.b — Factors affecting capital structure and the WACC
Firms usually aim for the capital structure that minimizes the WACC, and they try to match the maturity of their financing to the life of their assets. The factors that shape capital structure are essentially those that determine a company's capacity to service debt.
- Internal factors: business and industry characteristics, life cycle stage, existing leverage, and the corporate tax rate.
- External factors: conditions in the market and the business cycle, regulation, and industry norms.
The corporate tax rate matters because interest is tax-deductible: the higher the rate, the larger the tax saving from each unit of debt.
Features of a company that let it carry more debt:
- Revenue that is growing or stable, and cash flow that is growing and predictable.
- Low business risk (operational risk and demand risk).
- Plenty of liquid, tangible assets that can be pledged as collateral. Creditors prefer tangible assets that can be sold without much loss of value, or that are fungible, over intangible assets. A firm that owns its productive assets outright has more collateral than one that uses assets owned by others, as in a franchise model.
- Low cost and ready availability of debt.
- Low existing leverage and low earnings volatility. Analysts gauge debt capacity with leverage ratios (debt-to-equity, debt-to-operating profit) and coverage ratios, such as interest coverage .
Other things equal:
Key concept
| Supports more debt | Supports less debt |
|---|---|
| Noncyclical industry | Cyclical industry |
| Low operating leverage (low fixed costs as a share of total costs) | High fixed operating costs |
| Subscription-based revenue | Pay-per-use revenue |
| Liquid tangible assets owned outright | Mostly intangible assets, or assets owned by others |
The life cycle stage shows these factors at work:
Key concept
| Stage | Cash flows and risk | Typical financing |
|---|---|---|
| Start-up | Low or negative earnings and cash flow, high business risk, few assets | Almost all equity; possibly convertible debt (if the share price is rising fast) or leasing |
| Growth | Rising revenue and cash flow, business risk falling | Some debt, used conservatively, often secured by fixed assets or receivables |
| Mature | Slower growth, stable and significant cash flow, low business risk | Significant debt, including unsecured debt at relatively low cost |
A start-up's debt would be very risky, so lenders would demand high interest rates, and its small base of receivables and fixed assets offers little collateral. Convertible debt suits a start-up with a fast-rising share price because it costs less than straight debt and postpones the dilution of existing shareholders.
Top-down factors are macroeconomic conditions (inflation, real GDP growth, monetary policy and exchange rates) that move benchmark rates and credit spreads. In downturns, lenders demand wider spreads, especially from companies in cyclical industries. Some industries benefit from particular conditions; for example, spreads of oil producers tend to narrow when oil prices rise.
Common exam traps
- A start-up is financed almost exclusively with equity, even if it is growing fast.
- High fixed operating costs point to less debt, not more: operating leverage and financial leverage both make earnings more volatile.
Bottom line
- With debt and common equity only, , where each weight is that source's share of total capital; preferred stock adds with no tax adjustment.
- Debt costs less than equity because debtholders have a prior claim, and because interest is tax-deductible in most jurisdictions the cost of debt enters the WACC after tax, while the cost of equity does not.
- WACC weights can be target or market value weights, and market values are the right basis for today's opportunity cost of capital.
- The WACC is the discount rate for a project that mirrors the existing business and is financed in the firm's normal proportions.
- Capital structure reflects the capacity to service debt, shaped by internal factors (business characteristics, life cycle stage, existing leverage, tax rate) and external factors (market and business cycle conditions, regulation, industry norms).
- Stable or growing revenue and cash flow, low business risk, low operating leverage and liquid tangible assets owned outright support more debt, so start-ups are financed almost entirely with equity, growth firms use some debt and mature firms significant debt.
Quick check
Harlan Steelworks has no preferred stock. An equity analyst wants a WACC figure that measures Harlan's current opportunity cost of capital, and she has collected these data:
| Item | Value |
|---|---|
| Debt, market value | $175 million |
| Debt, book value | $200 million |
| Common equity, market value | $525 million |
| Common equity, book value | $900 million |
| Yield to maturity on Harlan's bonds (pretax cost of debt) | 5.6% |
| Cost of common equity | 13.2% |
| Marginal tax rate | 25% |
Interest expense is tax-deductible. Harlan's WACC is closest to:
Show answer and explanation
Correct answer: A
Market-value weights reflect current market conditions, so they are the right weights for measuring the current opportunity cost of capital. Total capital at market value is million, so debt is 25% and equity 75%. Because interest is tax-deductible, the cost of debt enters the WACC after tax.
Market-value weights: ; .
After-tax cost of debt: .
Why the other options are wrong
- B. 11.30% uses the correct market-value weights but the 5.6% pretax cost of debt: . It ignores the tax deductibility of interest.
- C. 11.56% weights debt and equity by book values, and : . Book values do not reflect current market conditions; here the book value of equity is far above its market value, so book weights overstate the weight of equity, the more expensive source.
Key takeaway For the current cost of capital, weight each source by its market value (or by management's target weights) and use the after-tax cost of debt. Book values can differ sharply from market values, especially for equity.
Module 25.2
Capital Structure Theories
LOS 25.c — The Modigliani–Miller propositions
The assumptions
The capital structure propositions of Modigliani and Miller (MM) rest on these assumptions: capital markets are perfectly competitive, with no taxes, transactions costs or bankruptcy costs; all investors hold homogeneous expectations; borrowing and lending are available to investors at the risk-free rate; agency costs are absent; and financing choices have no effect on investment decisions, so the firm's operating income does not depend on its mix of debt and equity.
MM Proposition I (no taxes): capital structure irrelevance
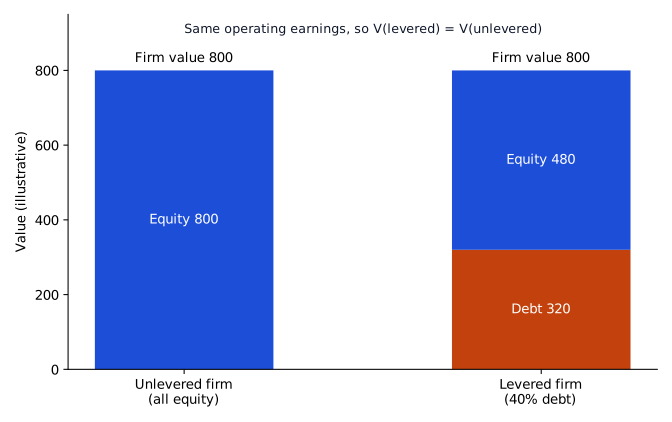
With these assumptions in place, changing the capital structure does not change firm value: , where is the value of the levered firm and the value of an otherwise identical unlevered (all-equity) firm. The size of the "pie" (the value of the firm's operating earnings, EBIT) stays the same however it is divided between debtholders and shareholders. An investor who owned all of the debt and equity of a levered firm would receive the same EBIT as the owner of an identical all-equity firm.
MM Proposition II (no taxes): cost of equity and leverage
The cost of equity rises linearly with the debt-to-equity ratio. Debtholders have a prior claim, so the residual cash flows left to shareholders become riskier as debt increases:
Key concept
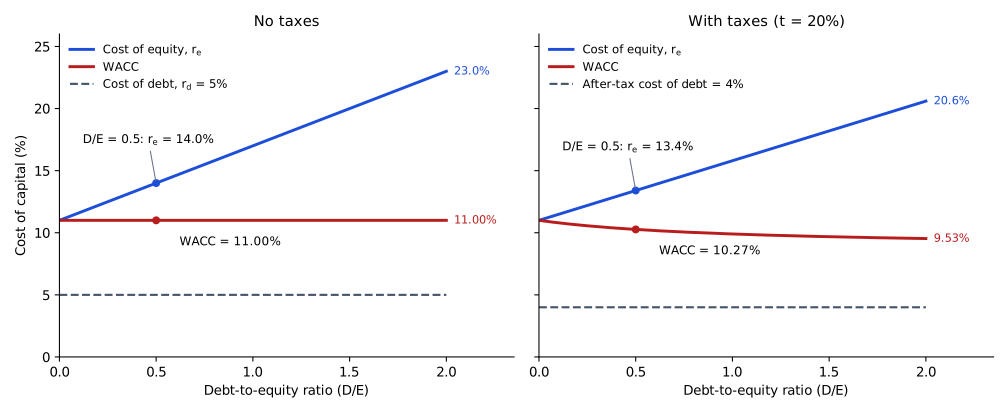
where is the cost of equity, is the cost of equity of the firm if it had no debt (all equity), is the cost of debt and is the debt-to-equity ratio. Promised payments to debtholders are more certain than the residual cash flows to shareholders, so . The formula follows from Proposition I: if the WACC equals whatever the mix, then , and solving for gives the line above. reflects the business risk of the firm's operations, which the financing mix does not change. As rises, the cost of equity rises while the cost of debt stays the same. The benefit of using more low-cost debt is exactly offset by the higher cost of equity, so the WACC is unchanged. This is consistent with Proposition I.
MM with taxes
When interest is tax-deductible, debt creates a debt tax shield worth :
With taxes, the government's slice of the pie shrinks as debt rises. Firm value is therefore maximized, and the WACC minimized, at 100% debt. The cost of equity still rises with leverage, but more slowly:
Example. Let , , and . Without taxes, . With taxes, . Separately, an unlevered firm worth 500 that adds 200 of debt at a 25% tax rate is worth under MM with taxes.
Key concept
| MM without taxes | MM with taxes | |
|---|---|---|
| Firm value | Unaffected by capital structure | Rises with debt; maximum at 100% debt |
| WACC | Constant | Falls as leverage rises; minimum at 100% debt |
| Cost of equity | Rises linearly with D/E | Rises with D/E, but less steeply (factor ) |
The figure draws both cases with the example inputs (, , ).
Costs of financial distress
In practice firms do not use 100% debt or anything close to it. MM themselves suggested that differences in investors' tax rates on dividends and on interest income could help explain observed capital structures. Current theory points instead to a cost the model leaves out, the costs of financial distress: the extra costs a firm faces when falling earnings make its fixed financing costs hard to pay. These costs rise with leverage. Expected costs of financial distress have two components:
- The costs incurred if distress occurs. Direct costs are the legal and administrative fees of bankruptcy. Indirect costs include forgone investment opportunities and the lost trust of customers, suppliers, creditors and employees. Conflicts between managers (acting for shareholders) and debtholders add the agency costs of debt.
- The probability of financial distress, which rises with operating and financial leverage and with weak management and corporate governance.
Other things equal, higher expected costs of financial distress discourage heavy use of debt.
LOS 25.d — Optimal and target capital structures
Static trade-off theory
The static trade-off theory balances the value of the debt tax shield against the expected costs of financial distress:
Key concept
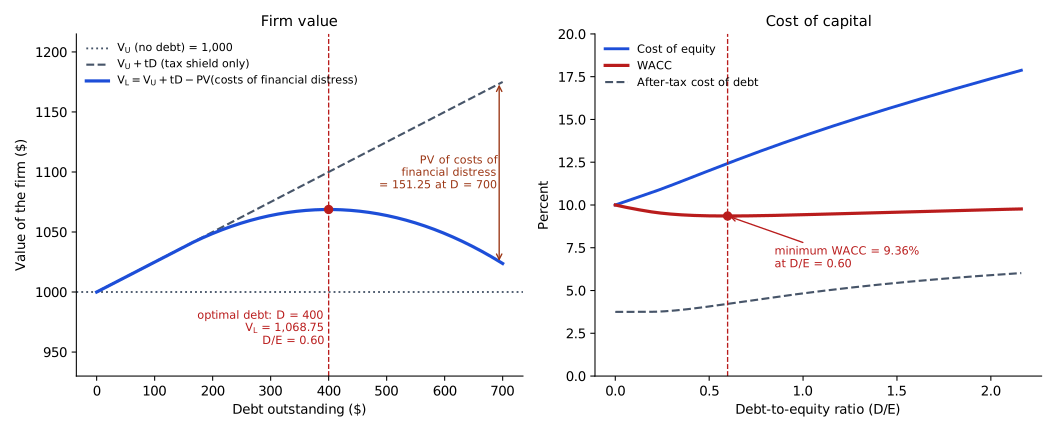
As debt increases, the tax shield keeps increasing, but beyond some point the extra expected distress costs outweigh the extra tax benefit. The optimal capital structure is the debt level at which firm value is maximized and the WACC is minimized. Because is constant, this is also where is largest.
- Firm value first rises and then falls as leverage increases; the WACC first falls and then rises (a U shape).
- The cost of equity rises throughout as leverage increases.
- The optimum differs across firms. It depends on business risk, the tax rate, corporate governance, industry and other factors.
The figure shows firm value and the costs of capital with illustrative numbers: an unlevered firm worth 1,000, a 25% tax rate and distress costs that start once debt passes 150.
Target capital structure
The target capital structure is the mix a firm aims for on average over time, reflecting management's view of the optimal structure. WACC weights should reflect the target, measured at market values. An analyst can use management's stated target when one is given, but most firms do not publish a target, so an external analyst estimates it from (1) the current market-value capital structure, (2) the current structure adjusted for a visible trend, or (3) industry-average weights.
Book values are also common in practice. Analysts often estimate target weights from the book values of debt and equity, and managers often think in book values for three reasons: short-term market swings do not change the appropriate amount of debt, management cares about how capital is deployed to projects, and rating agencies use book values.
Actual capital structures fluctuate around the target because of:
- changes in market values, especially of equity;
- management exploiting opportunities, such as issuing equity after a temporary share-price rise;
- external capital being raised in minimum-size lots.
Deviations caused by these three reasons are a normal part of how an actual capital structure moves around its target.
Asymmetric information, signaling and pecking order theory
Costs of asymmetric information arise because managers know more about the firm's prospects than investors do. They are higher for firms with complex products or opaque financial statements, and they raise required returns on both debt and equity. The larger the share of equity in the capital structure, the higher the cost of asymmetric information. Investors read financing choices as signals. Taking on debt, a commitment to fixed payments, signals confidence; issuing equity is often read as a sign that management believes the shares are overvalued.
Pecking order theory says managers prefer the financing least likely to send a negative signal, ranked by visibility to investors:
- Internally generated funds (retained earnings), the most preferred source;
- Debt;
- New external equity, the least preferred source.
Capital structure is then a by-product of individual financing decisions rather than a deliberate target.
Agency costs of equity
Agency costs of equity stem from conflicts between managers and shareholders. Managers without an ownership stake do not bear the cost of excessive pay or of taking too much or too little risk, so shareholders spend money to limit the conflict. The net agency costs of equity that result have three components:
| Component | Meaning | Examples |
|---|---|---|
| Monitoring costs | Supervising management; lower with strong corporate governance | Reporting to shareholders, board of directors' pay |
| Bonding costs | Assuring shareholders that managers act in their interest | Insurance premiums guaranteeing performance; implicit costs of noncompete agreements |
| Residual losses | Losses that remain despite monitoring and bonding | Imperfect guarantees |
Under the free cash flow hypothesis, more debt reduces agency costs because interest payments leave managers less free cash flow to spend for their own benefit.
Common exam traps
- MM with taxes and no distress costs leads to 100% debt. The static trade-off theory leads to an optimum below 100% debt.
- Bonding and monitoring costs belong to the net agency costs of equity. They are not part of pecking order theory.
- Under pecking order theory debt ranks ahead of new equity even though equity carries no default risk. The ranking follows how visible the source is and how negative a signal it sends, not its cost.
Exam shortcuts
- Match the theory to its conclusion: MM without taxes makes capital structure irrelevant, MM with taxes points to 100% debt, the static trade-off theory gives an optimum below 100% debt, and pecking order theory has no target, with internal funds used first.
Bottom line
- The MM propositions assume perfectly competitive markets with no taxes, transactions or bankruptcy costs, homogeneous expectations, borrowing and lending at the risk-free rate, no agency costs, and operating income unaffected by financing.
- Without taxes, MM Proposition I gives , and Proposition II gives , so the cost of equity rises with leverage while the WACC is unchanged.
- With taxes, , firm value is maximized and the WACC minimized at 100% debt, and the cost of equity rises more slowly, .
- Expected costs of financial distress combine the direct and indirect costs of distress with its probability, which rises with operating and financial leverage and weak management or governance, and they discourage heavy use of debt.
- Under the static trade-off theory , so the optimal capital structure, where firm value is highest and the WACC lowest, lies below 100% debt; analysts without a stated target estimate it from the current market-value structure, its trend or industry averages.
- Pecking order theory ranks internal funds first, then debt, then new external equity, by how visible and negative a signal each sends, and under the free cash flow hypothesis more debt reduces the agency costs of equity.
Quick check
Sorrel Systems would have a cost of equity of 10.5% if it had no debt. The company borrows at 6.0%, has a debt-to-equity ratio of 0.6, and faces a 25% corporate tax rate. Under Modigliani and Miller's Proposition II with taxes, Sorrel's cost of equity is closest to:
Show answer and explanation
Correct answer: B
MM Proposition II says the cost of equity rises linearly with the debt-to-equity ratio. With taxes, the leverage premium is scaled down by because the debt tax shield absorbs part of the extra risk borne by shareholders.
Why the other options are wrong
- A. 13.20% is the no-tax version of Proposition II; it omits the factor.
- C. 11.77% uses the debt-to-total-capital ratio () instead of the debt-to-equity ratio of 0.6.
Key takeaway MM II with taxes: . The leverage term uses D/E; using D/V is a common error.
Practice Questions
Treloar Bakeries' revenue growth has slowed to a few percent a year, its operating cash flow is large and stable, and its business risk is low. Given its life cycle stage, Treloar is most likely to be financed with:
Show answer and explanation
Correct answer: B
Treloar has the features of a mature company: slower growth, significant and stable cash flow and low business risk. Mature companies can support substantial debt, and lenders offer it widely, including unsecured debt, at a relatively low cost.
Why the other options are wrong
- A. Almost all-equity financing, sometimes with convertible debt or leasing, fits a start-up with low or negative cash flow, high business risk and little collateral.
- C. Conservative, secured debt fits a growth-stage company whose cash flow is rising but whose business risk is still higher than a mature company's.
Key takeaway Start-up: almost all equity; growth: some secured debt; mature: significant debt, including unsecured.
Halvard Retail generates far more cash than it can invest profitably. One of its directors argues that the company should take on more debt, because the required interest and principal payments would leave management with less spare cash to spend on lavish perks and low-return acquisitions. The director's argument is most consistent with:
Show answer and explanation
Correct answer: C
Under the free cash flow hypothesis, debt disciplines managers. Committing cash to interest and principal payments reduces the free cash flow that managers could use for their own benefit, and it forces them to run the company efficiently so that those payments can be met. Greater financial leverage therefore tends to reduce the agency costs of equity.
Why the other options are wrong
- A. Pecking order theory ranks financing sources by how negative a signal they send under asymmetric information: internal funds first, then debt, then new external equity. It does not argue for borrowing to take cash away from managers.
- B. Debt signaling holds that taking on fixed payment obligations tells outside investors that management is confident about future cash flows. The director's concern is curbing managers' use of spare cash; she says nothing about what the borrowing would tell investors.
Key takeaway Free cash flow hypothesis: more debt leaves managers less free cash flow to misuse, which lowers the agency costs of equity. Pecking order: internal funds, then debt, then external equity. Signaling: new debt signals confidence, while new equity is often read as a sign of overvaluation.
This reading has 28 questions in the full bank. Practice all of them.
Key Takeaways
- For the current cost of capital, weight each source by its market value (or by management's target weights) and use the after-tax cost of debt. Book values can differ sharply from market values, especially for equity.
- Start-up: almost all equity; growth: some secured debt; mature: significant debt, including unsecured.
- MM II with taxes: . The leverage term uses D/E; using D/V is a common error.
- Free cash flow hypothesis: more debt leaves managers less free cash flow to misuse, which lowers the agency costs of equity. Pecking order: internal funds, then debt, then external equity. Signaling: new debt signals confidence, while new equity is often read as a sign of overvaluation.