Economics · Reading 13
Business Cycle
CFA Level I · Economics · Reading 13: Understanding Business Cycles · about 30 min
What you'll learn
- LOS 13.a Describe the business cycle, its four phases (trough, expansion, peak, contraction) and the classical, growth and growth rate cycle measures.
- LOS 13.b Describe credit cycles and how they interact with and can amplify business cycles.
- LOS 13.c Describe how inventories, labor and capital use, consumer, housing and external trade activity vary over the cycle, and classify leading, coincident and lagging indicators.
Module 13.1
Business Cycles
This reading describes the four phases of the business cycle, how cycles are drawn and dated, and how credit cycles interact with them. It then explains how inventories, the use of labor and capital, consumer spending, housing and external trade change over the cycle, and how leading, coincident and lagging indicators help identify its turning points.
LOS 13.a — The business cycle and its four phases
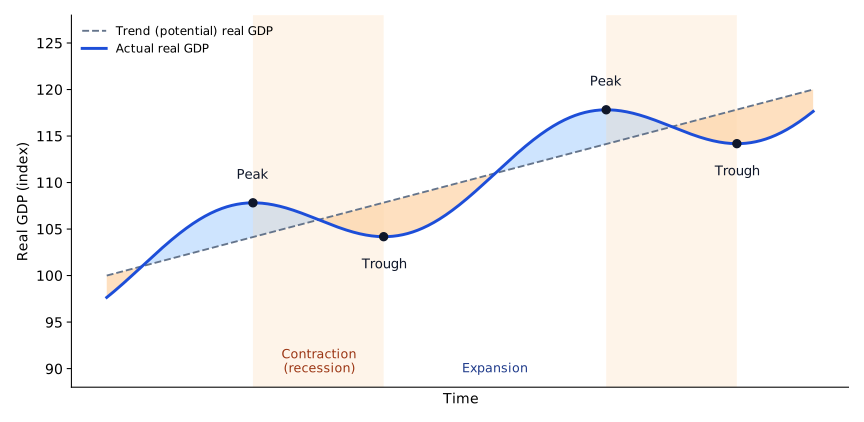
A business cycle is the recurring (but irregular) swing of aggregate economic activity, usually tracked through real GDP. Most sectors of the economy grow together in an expansion and shrink together in a contraction. Every cycle passes through four phases:
Key concept
| Phase | What real GDP is doing | Typical conditions |
|---|---|---|
| Trough | Stops falling and starts rising; growth turns from negative to positive | Unemployment high; firms start using more overtime and temporary staff; durable goods and housing spending may pick up; inflation moderate or still falling; employment growth may not pick up until the recovery is well established |
| Expansion | Rising | GDP growth picks up; unemployment falls as hiring speeds up; investment in equipment and new homes rises; inflation may rise; imports rise with domestic incomes |
| Peak | Reaches its highest level for the cycle, then starts to fall | Growth slows; unemployment is still falling, but hiring slows; consumer and business spending grow more slowly; inflation is rising |
| Contraction (recession) | Falling | Hours worked cut, unemployment rises; consumer spending, home building and business investment fall; inflation eases, but with a lag; imports fall |
Three ways to draw a cycle.
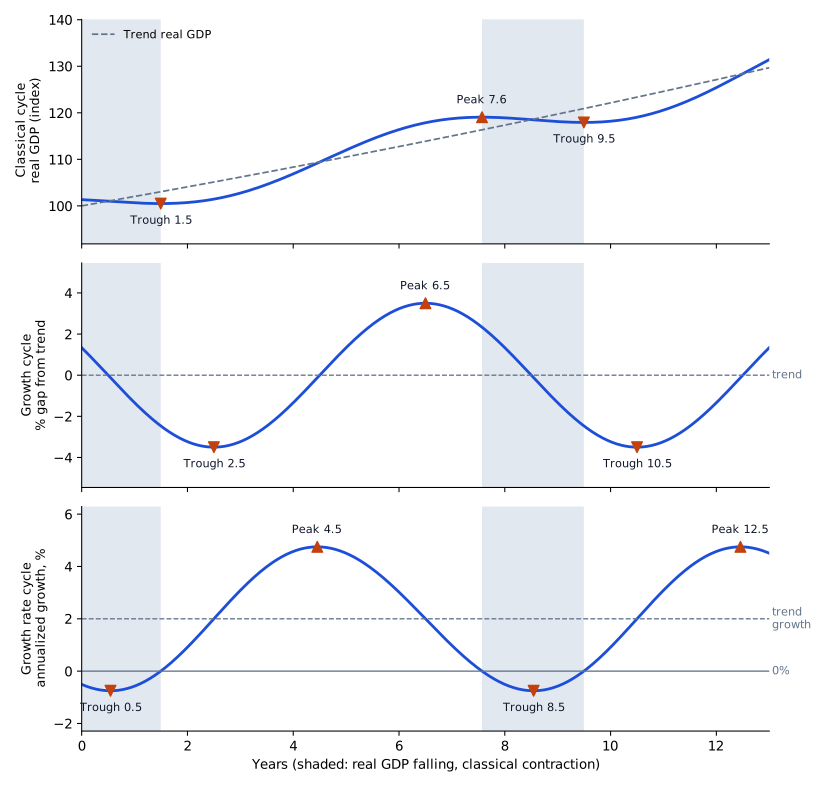
- The classical cycle plots the level of real GDP against a starting value; turning points are highs and lows in the level.
- The growth cycle plots the percentage gap between real GDP and its long-term trend (potential) value.
- The growth rate cycle plots the period-to-period (annualized) growth rate of real GDP. It tends to turn earlier than the other two measures, at both peaks and troughs. Growth starts to slow while the level of GDP is still rising, and starts to recover while the level is still falling, so the growth rate reaches its high and low points first. Exam convention: the growth rate cycle is the measure economists and practitioners prefer, and it shows GDP relative to a trend rate, like the growth cycle. Current practice: the gap between GDP and its trend is what the growth cycle measures; the growth rate cycle tracks the growth rate itself, which can then be compared with the trend growth rate.
The figure below draws one real GDP path all three ways, with the classical contraction shaded.
Dating a cycle. A common rule of thumb treats two consecutive quarters of falling real GDP as the start of a contraction, and two consecutive quarters of rising real GDP as the start of an expansion. Official dating bodies (in the US, the National Bureau of Economic Research) also weigh unemployment, industrial production, inflation and other data.
Worked example. Real GDP starts at an index of 100.0 and grows as follows over nine quarters:
| Quarter | 1 | 2 | 3 | 4 | 5 | 6 | 7 | 8 | 9 |
|---|---|---|---|---|---|---|---|---|---|
| Growth, quarter on quarter (%) | 0.6 | 1.0 | 0.6 | 0.3 | -0.1 | -0.5 | -0.2 | 0.3 | 0.8 |
| Real GDP (index) | 100.60 | 101.61 | 102.22 | 102.52 | 102.42 | 101.91 | 101.70 | 102.01 | 102.83 |
- Classical cycle: the level of real GDP peaks in quarter 4 (102.52) and bottoms in quarter 7 (101.70).
- Rule of thumb: real GDP falls in quarters 5 and 6, two quarters in a row, so a contraction began after quarter 4. The rises in quarters 8 and 9 mark the start of the next expansion.
- Growth rate cycle: growth is highest in quarter 2 and lowest in quarter 6, two quarters before the level peaks and one quarter before it bottoms.
Cycles are not regular. They recur, but their length and severity vary widely, from about a year to more than a decade. The concept applies to economies made up mainly of private businesses. Subsistence and centrally planned economies do not have business cycles in this sense.
Common exam traps
- "Growth turns from negative to positive" describes the trough. The expansion is the phase that follows it.
- Easing inflation belongs to the contraction, not to the expansion or the peak.
- In a contraction, real GDP growth is low or negative, never above its sustainable long-run rate.
LOS 13.b — Credit cycles
Credit cycles are cyclical swings in the availability of loans and in interest rates. In expansions lenders are eager to lend and charge lower rates. When the economy slows, they tighten standards and demand higher rates.
- Credit cycles tend to amplify business cycles. Expansions that coincide with easy credit tend to be stronger, and contractions that coincide with tight credit tend to be deeper and longer.
- Loose credit can feed asset price bubbles, meaning prices built on unrealistic expectations. Housing and mortgage credit before 2007–2009 is the classic case.
- The two cycles do not always line up. On average, credit cycles have lasted longer than business cycles.
- Credit-sensitive sectors such as construction and housing move most closely with the credit cycle.
Common exam traps: an option saying that credit cycles dampen business cycles, or that they are shorter than business cycles, reverses the relation.
LOS 13.c — How activity varies over the cycle, and economic indicators
Inventories and the inventory-sales ratio. Firms aim for a normal inventory-sales ratio during steady growth.
- Late in an expansion (approaching the peak): sales growth slows while production still reflects optimistic plans, so unsold goods pile up and the ratio rises above normal. Firms then cut production, which helps bring on the contraction. Unplanned inventory growth counts as output in GDP, so GDP alone may look strong just as weakness begins.
- Near the trough: firms have already cut output. When sales pick up, inventories run down quickly and the ratio falls below normal, so firms raise production to restock.
- Inventories falling faster than planned mean sales are running ahead of production, so firms raise output to rebuild stock. If the economy is already at full employment, the extra spending also tends to push inflation up, as it does when an expansion nears its peak.
Worked example. A distributor normally holds inventory of 1.5 times monthly sales, for example 330 against sales of 220. Late in an expansion, sales slip to 210 while deliveries planned earlier lift inventory to 357. The ratio is now , well above normal, which is a signal to cut orders and production.
Labor and physical capital. Hiring and firing are costly and hurt morale, so firms adjust existing resources first:
Key concept
| Early response (change intensity) | Later response (change capacity), once the trend looks durable | |
|---|---|---|
| Labor | Change overtime and output per hour | Hire (expansion) or lay off workers (contraction) |
| Physical capital | Run existing plant and equipment more or less intensively | Expansion: invest in new capacity. Contraction: defer maintenance and delay replacing worn-out equipment rather than sell assets |
Consumer sector. Consumer spending is the largest part of GDP and rises and falls with current and expected income.
- Durable goods (cars, appliances, furniture) are the most cyclical. Buyers postpone them in contractions and sometimes into early recovery.
- Services are moderately cyclical: travel and restaurant meals are discretionary, while health care and telecom are not.
- Nondurable goods (groceries, household supplies) are the least cyclical.
Housing sector. Housing is small relative to consumer spending but swings sharply. Its main drivers are:
- Mortgage rates: low rates stimulate buying and building.
- Housing costs relative to income: activity can fall late in an expansion if prices outrun incomes.
- Speculative activity: rising prices attract buyers who expect further gains, which leads to overbuilding and then a slump.
- Demographics: a larger share of people aged 25–40 means more household formation, and urbanization raises construction needs.
External trade sector.
- Imports rise with domestic GDP growth: when home incomes rise, residents buy more foreign goods.
- Exports depend mainly on the GDP growth of trading partners.
- An appreciating domestic currency tends to raise imports and reduce exports; a depreciating currency does the reverse. Currency effects work through persistent trends and can point in a different direction from GDP effects. GDP effects are more direct and immediate.
Economic indicators.
Key concept
| Type | Turning points and use | US examples |
|---|---|---|
| Leading indicators | Before peaks and troughs; used to anticipate a turn | Average weekly hours in manufacturing; average weekly initial claims for unemployment insurance; manufacturers' new orders; building permits for private housing; the S&P 500 index; the 10-year Treasury minus fed funds spread; average consumer expectations for business conditions (index of consumer expectations); ISM new orders index; Leading Credit Index |
| Coincident indicators | At about the same time; show the current phase | Employees on nonagricultural payrolls; personal income less transfer payments; manufacturing and trade sales; industrial production |
| Lagging indicators | After the turn is under way; confirm a turn that has already happened | Average duration of unemployment; ratio of manufacturing and trade inventories to sales; change in unit labor costs; average bank prime rate; commercial and industrial loans outstanding; ratio of consumer installment credit to personal income; change in CPI for services |
Other countries build their own composite indexes from different components.
Most leading series turn early for a plain reason: they record decisions that come before output changes. Firms cut overtime (average weekly hours) before they lay workers off, new orders and building permits come before production and construction, and share prices reflect expected future earnings.
Common exam traps
- The inventory-sales ratio is sometimes used in forecasting, but it is classified as a lagging indicator because it peaks after the economy does.
- Initial jobless claims lead; the duration of unemployment lags.
- Layoffs and asset sales are not a firm's first response to a slowdown.
- Domestic expansion raises imports. It does not directly raise or cut exports.
Exam shortcuts
- The growth rate cycle reaches its high and low points before the level of real GDP does, because growth slows while the level is still rising and recovers while the level is still falling.
- Series that record decisions made before output changes, such as average weekly hours, new orders, building permits and share prices, are leading indicators.
Bottom line
- The business cycle has four phases: trough (real GDP stops falling and growth turns positive), expansion (real GDP rising), peak (real GDP at its high for the cycle, then starting to fall) and contraction or recession (real GDP falling).
- The classical cycle plots the level of real GDP and the growth cycle its percentage gap from trend; the growth rate cycle turns earlier at peaks and troughs and, under the exam convention, is the preferred measure that shows GDP relative to a trend rate, while in current practice it tracks the growth rate itself, which can be compared with trend growth.
- A common rule of thumb dates a contraction from two consecutive quarters of falling real GDP and an expansion from two consecutive quarters of rising real GDP, while official dating bodies also weigh unemployment, industrial production and inflation.
- Credit cycles, swings in loan availability and interest rates, tend to amplify business cycles, can feed asset price bubbles and have on average lasted longer than business cycles.
- The inventory-sales ratio rises above normal late in an expansion as sales growth slows, leading firms to cut production, and falls below normal near the trough as sales pick up, leading firms to raise output.
- Firms first change how intensively they use existing workers and equipment, and only once the trend looks durable do they hire or lay off workers, invest in new capacity, or defer maintenance and delay replacing equipment.
- Durable goods spending is the most cyclical, services spending moderately cyclical and nondurable goods spending the least; imports rise with domestic GDP growth, while exports depend mainly on trading partners' growth.
- Leading indicators turn before peaks and troughs, coincident indicators turn at about the same time, and lagging indicators turn after a new phase is under way and confirm it.
Quick check
An economy that is in the contraction phase of the business cycle would most typically display:
Show answer and explanation
Correct answer: C
A contraction (recession) is a period of declining real GDP. Weaker demand and rising unemployment reduce pressure on prices, so inflation pressure typically decreases, often with a lag.
Why the other options are wrong
- A. Unemployment usually rises in a contraction because hours are cut and, if the downturn persists, workers are laid off.
- B. In a contraction real GDP growth is low or negative. Growth above the sustainable rate is associated with an expansion, especially one nearing its peak.
Key takeaway Contraction: output falls, unemployment rises, inflation eases.
Practice Questions
A bank economist makes three claims about the lending (credit) cycle and its link to the business cycle. Which claim is least accurate?
Show answer and explanation
Correct answer: C
Historical evidence suggests credit cycles have been longer on average than business cycles, so a claim that they are shorter is inaccurate. The other two statements are accurate: loose lending in good times can inflate asset prices beyond plausible levels, and expansions and contractions tend to be stronger and deeper when they coincide with credit cycles.
Why the other options are wrong
- A. Accurate. Loose credit can fuel bubbles, as happened with subprime mortgages before the 2007–2009 financial crisis.
- B. Accurate. Credit availability rises in expansions and shrinks in slowdowns, which reinforces the business cycle rather than dampening it.
Key takeaway Credit cycles amplify business cycles, can cause bubbles, and have tended to last longer than business cycles.
Orders at Brightwater Castings, a maker of pump housings, have started to fall as the economy begins to contract. Management is not yet convinced the downturn will last and wants to keep its workforce and its productive capacity intact for now. Its first adjustment is most likely to be:
Show answer and explanation
Correct answer: C
Hiring and firing are costly and damage morale, so at the start of a slowdown firms reduce output by using existing labor and capital less intensively, for example by trimming overtime. Only when the contraction looks persistent do they reduce capacity by laying off workers and cutting physical capital, typically by deferring maintenance or not replacing worn equipment.
Why the other options are wrong
- A. Layoffs are a later step, taken once management believes the contraction is likely to persist. They are not the initial response while the outlook is uncertain.
- B. Deferring maintenance is how firms shrink physical capacity. It cuts the capacity management wants to keep, so it belongs to the stage when the downturn looks durable.
Key takeaway Sequence in a slowdown: first reduce intensity of use (overtime, hours), then reduce capacity (layoffs, deferred maintenance).
An analyst wants a US data series that tends to change direction before the overall economy does. Which of the following should she choose?
Show answer and explanation
Correct answer: A
Consumer expectations about business conditions are a leading indicator: sentiment tends to turn before actual spending and output do.
Why the other options are wrong
- B. The average duration of unemployment is a lagging indicator. Spells of joblessness lengthen only after a contraction has been under way for a while.
- C. Industrial production is a coincident indicator; it moves with the cycle rather than ahead of it.
Key takeaway Expectations and orders lead; production and sales are coincident; duration, inventories-to-sales and the prime rate lag.
This reading has 21 questions in the full bank. Practice all of them.
Key Takeaways
- Contraction: output falls, unemployment rises, inflation eases.
- Credit cycles amplify business cycles, can cause bubbles, and have tended to last longer than business cycles.
- Sequence in a slowdown: first reduce intensity of use (overtime, hours), then reduce capacity (layoffs, deferred maintenance).
- Expectations and orders lead; production and sales are coincident; duration, inventories-to-sales and the prime rate lag.