Equities · Reading 43
Introduction to Equity Valuation
CFA Level I · Equities · Reading 43 · about 33 min
What you'll learn
- LOS 43.a Contrast market price with intrinsic and perceived value, and the naïve, relative and absolute approaches to valuation.
- LOS 43.b Contrast book value of equity, market capitalization and enterprise value as indicators of intrinsic value, including P/B and EV/EBITDA.
- LOS 43.c Describe present value, asset-based and multiplier valuation models and their advantages and disadvantages.
Module 43.1
Measures and Models of Equity Value
This reading separates market price from intrinsic value and describes naïve, relative and absolute ways of forming a perceived value. It shows how to calculate book value, market capitalization, P/B and enterprise value, and how to tell the categories of valuation model apart.
LOS 43.a — Price versus value
Market price is observable: it is what the shares trade at. Intrinsic value (fundamental value) is the value a rational investor would place on the stock with full knowledge of its characteristics; it cannot be observed, so analysts estimate it with valuation models.
Each investor's own estimate, based on his or her assumptions, is a perceived value, and market prices aggregate the perceived values of active participants. Compare perceived value with price:
| Perceived value vs. market price | Investor's view | Likely action |
|---|---|---|
| Higher | Undervalued | Buy / overweight |
| Lower | Overvalued | Sell / underweight |
| Equal | Fairly valued | Hold |
Three ways investors form a perceived value
Key concept
| Approach | Basis | Example |
|---|---|---|
| Naïve or story-based valuation | An informal story with no link to the company's finances or fundamentals | Meme stocks driven by social-media buzz; cult stocks whose value rests on devotion to a founder or product |
| Relative valuation | Compare the company's multiples with a peer group; similar companies should trade at similar multiples (e.g., P/E, P/B, EV/EBITDA) | "Its P/E is below the sector average, so it looks cheap" |
| Absolute valuation (fundamental valuation) | The company's own characteristics only, without a benchmark — e.g., present value of expected future cash flows at a risk-adjusted discount rate | A dividend discount or free cash flow model |
Ranges and scenarios
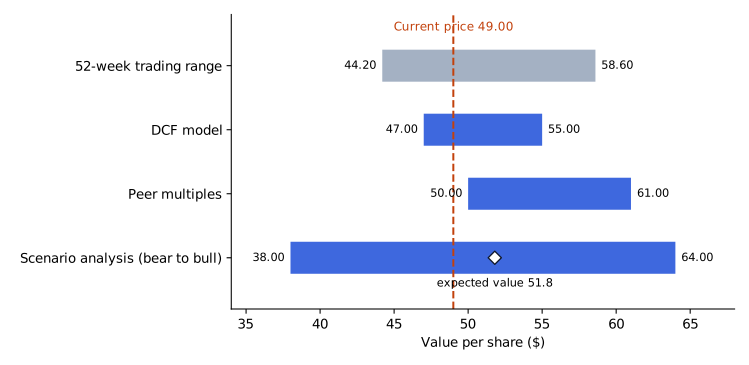
Analysts often express intrinsic value as a range (from different inputs or different models) and compare it with the stock's recent trading range, sometimes side by side in a floating bar valuation chart. In scenario analysis the analyst values the stock under a base case, a bullish (more favorable) case and a bearish (less favorable) case; the expected value is the probability-weighted average of the three.
Example. Base, bull and bear values of 50, 64 and 38 with probabilities 0.5, 0.3 and 0.2 give an expected value of .
Common exam traps
- A story with no financial analysis is naïve valuation, even if the story is plausible.
- P/E comparisons with peers are relative valuation.
LOS 43.b — Book value, market capitalization and enterprise value
Book value of equity is balance sheet assets minus liabilities (and minus minority, i.e., noncontrolling, interest). It rises when the company earns net income and retains it; a company that pays no dividends retains all of its net income, so positive net income raises its book value, other things equal. Equivalently, add up the components of stockholders' equity, excluding noncontrolling interest:
Exam convention: book value = share capital + additional paid-in capital + retained earnings − treasury stock. Current practice: stockholders' equity also contains accumulated other comprehensive income (AOCI) and other reserves, so they are added as in the formula above; the shorter version gives the same answer only when those items are zero. For instance, paid-in capital of 100, retained earnings of 0 and AOCI of +10 give a book value of 110.
Example. Common stock 400, additional paid-in capital 1,100, retained earnings 650, treasury stock (250) and noncontrolling interest 90 (all in millions). Book value (total equity of 1,990 less the 90 of noncontrolling interest). With 50 million shares, BVPS .
Limits of book value
Assets may be tangible (equipment, inventory) or intangible (patents, copyrights, goodwill). Carrying values of tangible assets depend on when they were bought and on the depreciation method, and accounting choices differ across companies, which affects BVPS comparisons. Internally generated intangibles (brands, know-how) are usually expensed and never appear on the balance sheet; purchased intangibles are amortized over their useful lives or impairment-tested. Goodwill arises when an acquirer pays more than the fair value of the target's net identifiable assets. Book value is therefore most useful for companies with substantial tangible assets (e.g., manufacturers) and least useful for early-stage or asset-light companies and those whose value lies in intangibles.
Negative book value means liabilities exceed assets. It is common in financial distress, but it can also occur at profitable, valuable companies, such as those growing rapidly or running aggressive share repurchases, because treasury stock is deducted from equity. Negative book value alone does not mean the shares cannot provide value to investors.
Market capitalization . It reflects the fair value of the company as a going concern, including investors' expectations about future earnings. It does not measure what the assets would fetch if sold piecemeal. Because it depends on expectations, net income that disappoints investors can lower market capitalization even as it raises book value.
- Market cap > book value: the firm is creating excess value.
- Market cap < book value: a value shortfall; the analyst should investigate whether the stock is undervalued or the company is uncompetitive.
The price-to-book ratio (P/B) expresses the same comparison as a ratio, so a P/B above 1 corresponds to excess value and a P/B below 1 to a value shortfall:
Key concept
Relative to a peer benchmark, a P/B well above (below) the benchmark suggests the stock is relatively overvalued (undervalued), absent a justifying reason. Example: at a price of 57 and BVPS of 38, P/B .
Enterprise value (EV) measures the value of the whole firm, roughly what it would cost to acquire it:
Key concept
Net debt equals the market value of debt less cash and short-term investments; cash is subtracted because the acquirer takes over the target's liquid assets along with its debt. EV is useful for comparing companies with very different capital structures (convert to a common currency first for cross-border comparisons). It is usually divided by EBITDA (or EBIT, or revenue).
The balance sheet usually carries debt at book value, so its market value often has to be estimated. For long-term debt the analyst uses financial market data, such as current prices of the firm's bonds. Short-term debt can be taken at book value if the firm is not in financial distress, because a debt instrument's market value moves toward its face value as maturity approaches.
Example. A firm has equity market value 2,850, no preferred stock, cash 150 and EBITDA 425. Its long-term debt is valued at 520 from bond prices and its short-term debt is taken at its book value of 180, so the market value of debt is 700. Then ; . If peers trade at 9×, the firm looks relatively undervalued.
| Measure | Based on | Viewpoint |
|---|---|---|
| Book value of equity | Balance sheet carrying values | Equity holders, accounting |
| Market capitalization | Share price × shares | Equity holders, market expectations |
| Enterprise value | Market value of equity and debt, less cash | All capital providers |
Common exam traps
- Additional paid-in capital and accumulated other comprehensive income are part of book value; treasury stock is subtracted; noncontrolling interest is excluded. In the example, keeping the 90 of noncontrolling interest gives a book value of 1,990 and a BVPS of 39.80 instead of 1,900 and 38.00.
- Do not forget to subtract cash when computing EV, or to include preferred stock. In the example, leaving out the 150 of cash gives an EV of 3,550 and an EV/EBITDA of 8.35× instead of 3,400 and 8.0×.
- P/B is price divided by BVPS; dividing BVPS by price inverts it. With a price of 57 and BVPS of 38, the inverted ratio is 0.67 instead of 1.5.
LOS 43.c — Categories of valuation models
Absolute valuation models use only company-specific information.
- Present value models (discounted cash flow models) value a share as the present value of expected future cash flows. Inputs: forecast cash flows over a forecast period, a terminal value, and a discount rate.
| Model | Cash flow | Discount rate | Best suited to |
|---|---|---|---|
| Dividend discount model | Dividends | Required return on equity | Mature firms with stable, predictable dividends |
| Free cash flow to equity (FCFE) | Cash available to shareholders after capital expenditures and working capital needs | Required return on equity | Non-dividend payers with stable capital structures |
| Free cash flow to the firm (FCFF) | Cash available to both debt and equity holders; gives firm value | Weighted average cost of capital (WACC) | Negative FCFE or unstable capital structure (heavy debt, big buybacks) |
| Residual income | Current book value + PV of future residual income (net income minus an equity charge on beginning book value) | Required return on equity | Non-payers or firms with negative free cash flow |
- Asset-based models estimate equity value as the fair value of assets minus liabilities and preferred stock (book values adjusted to fair values). They suit firms whose assets have readily available market values: mainly tangible, short-term (liquid) assets, resource companies with known reserves, real estate worth more than its cash flow potential, divisions being sold, and firms being liquidated. An asset-based model can give a floor value for the stock.
Relative valuation models (multiplier models) compare a ratio with peers:
- Equity multiples: the share price divided by a per-share measure such as EPS, sales, book value or cash flow. A trailing P/E uses the past year's EPS, a leading P/E uses next year's forecast EPS; P/E loses its usefulness when EPS is negative or very small, and reported earnings are usually adjusted for nonrecurring items.
- Enterprise value multiples: EV divided by EBITDA, EBIT or revenue. This second type of multiplier model looks at value from the viewpoint of both debt and equity holders.
Method of comparables example. A share trades at 45 with trailing EPS of 3.00, a P/E of 15; the peer average is 18, so the share is relatively undervalued (unless firm-specific factors justify the discount).
The table sets the three families side by side.
| Model family | Value is based on | Advantages | Disadvantages |
|---|---|---|---|
| Present value (discounted cash flow) models | PV of expected dividends, FCFE or FCFF; for residual income, current book value plus PV of future residual income | Grounded in finance theory; assumptions such as growth and margins can be changed to see their effect on value | Inputs must be estimated; the value is highly sensitive to them |
| Asset-based models | Fair value of assets minus liabilities and preferred stock | Give a floor value; useful for divisions being sold and firms being liquidated; most reliable when assets are mainly tangible and short-term or have ready market values; more practical as firms report fair values | Ignore the firm as a going concern (margins, efficient use of assets, competition); ignore taxes; unreliable when intangibles are significant |
| Multiplier (relative) models | Price or EV relative to earnings, sales, book value, cash flow or EBITDA | Compare the company directly with a peer benchmark | A multiple far from the benchmark may be justified by firm-specific factors; P/E loses its usefulness when EPS is negative or very small |
Analysts usually apply more than one model, with several sets of inputs, and arrive at a range of values. Different models can give inconsistent results. The analyst reconciles them by checking that the assumptions behind each approach are consistent and can combine them in a weighted average that puts more weight on the models whose inputs they trust most.
Common exam traps
- FCFF is discounted at the WACC; dividends, FCFE and residual income are discounted at the required return on equity.
- Fair values of assets and liabilities are the inputs of an asset-based model. A present value model needs forecast cash flows, a terminal value and a discount rate.
- Liquidation, or assets that are mostly liquid and tangible, points to an asset-based model.
- An EV/EBITDA comparison is a multiplier (relative valuation) model even though EV includes debt. It is not a discounted cash flow model.
Exam shortcuts
- Pick the model from the facts given: stable, predictable dividends point to a dividend discount model, a non-payer with a stable capital structure to FCFE, negative FCFE or an unstable capital structure to FCFF, and liquidation or mostly liquid tangible assets to an asset-based model.
Bottom line
- Intrinsic value cannot be observed and is estimated with valuation models; a perceived value above the market price means the stock looks undervalued, below it overvalued, and equal to it fairly valued.
- Naïve or story-based valuation rests on a story unconnected to the company's finances, relative valuation compares multiples with a peer group, and absolute valuation uses only the company's own characteristics, such as the present value of expected cash flows.
- Exam convention: book value of equity = share capital + additional paid-in capital + retained earnings − treasury stock; current practice also adds AOCI and other reserves, so the two agree only when those items are zero, and noncontrolling interest is excluded in both.
- Book value is most useful for companies with substantial tangible assets and least useful for early-stage or asset-light companies and those whose value lies in intangibles, and a negative book value alone does not mean the shares cannot provide value to investors.
- Market capitalization (share price × shares outstanding) reflects the company's fair value as a going concern, so a P/B above 1 signals excess value and a P/B below 1 a value shortfall to investigate.
- Enterprise value is the market value of the common and preferred stock and of the debt, less cash and short-term investments, and it is usually divided by EBITDA, EBIT or revenue to compare companies with different capital structures.
- In present value models, dividends, FCFE and residual income are discounted at the required return on equity, while FCFF, the cash available to both debt and equity holders, is discounted at the WACC to give firm value.
- An asset-based model values equity at the fair value of assets minus liabilities and preferred stock and can give a floor value, whereas multiplier models compare equity multiples or EV multiples with peers.
Quick check
Shares of Delvin Pharmacy trade at 14.0 times analysts' consensus forecast of next year's EPS, which is $3.20. Last year Delvin earned $2.90 per share. Using her own models, an analyst estimates the intrinsic value of a Delvin share at $40.00. From her point of view, Delvin shares are:
Show answer and explanation
Correct answer: C
The market price follows from the multiple and the earnings figure it is based on, here next year's forecast EPS. A stock whose market price is above the investor's estimate of intrinsic value is overvalued from that investor's point of view. The analyst's $40.00 is below the $44.80 price.
The shares are overvalued by $4.80.
Why the other options are wrong
- A. The size of the gap is right, but the direction is reversed. Undervalued would require intrinsic value above the market price.
- B. $0.60 applies the multiple to the EPS of the year just ended, . The multiple is stated on next year's forecast, so the price is .
Key takeaway Intrinsic value above price means undervalued; below price means overvalued. Pair each multiple with the earnings figure it is based on.
Practice Questions
An analyst gathers the following market and financial data for Tamsin Ridge Appliances (amounts in millions except the share price).
| Item | Value |
|---|---|
| Share price | $28.50 |
| Common shares outstanding | 12.0 million |
| Market value of preferred stock | $18 million |
| Market value of debt | $95 million |
| Cash and short-term investments | $31 million |
| EBITDA | $52 million |
Tamsin Ridge's EV/EBITDA multiple is closest to:
Show answer and explanation
Correct answer: B
Enterprise value is the market value of common and preferred stock plus the market value of debt, minus cash and short-term investments (an acquirer assumes the debt but also receives the cash). Dividing EV by EBITDA gives the multiple used for relative valuation.
Market value of common stock million.
Why the other options are wrong
- A. 7.8× leaves out the $18 million of preferred stock, which is part of the firm's equity capital.
- C. 8.8× forgets to subtract cash and short-term investments.
Key takeaway EV = common + preferred + debt − cash; then divide by EBITDA.
An analyst compares Tolliver Freight's ratio of enterprise value to EBITDA with the average ratio for other trucking companies. The analyst is using which type of valuation model?
Show answer and explanation
Correct answer: A
An enterprise value multiple expresses enterprise value relative to EBITDA, EBIT or revenue, and the analyst compares it across a peer group. That makes it a relative valuation (multiplier) model.
Why the other options are wrong
- B. An asset-based model values equity as the fair value of assets minus liabilities and preferred stock; it does not use a ratio compared with peers.
- C. A discounted cash flow model estimates value as the present value of forecast cash flows. It does not use a multiple of a current fundamental.
Key takeaway EV/EBITDA, P/E and P/B are all multiplier (relative valuation) models.
This reading has 19 questions in the full bank. Practice all of them.
Key Takeaways
- Intrinsic value above price means undervalued; below price means overvalued. Pair each multiple with the earnings figure it is based on.
- EV = common + preferred + debt − cash; then divide by EBITDA.
- EV/EBITDA, P/E and P/B are all multiplier (relative valuation) models.