Financial Statement Analysis · Reading 31
Free Cash Flow
CFA Level I · Financial Statement Analysis · Reading 31: Analyzing Statements of Cash Flows II · about 26 min
What you'll learn
- LOS 31.a Analyze and interpret reported and common-size cash flow statements, including sources and uses of cash and the sustainability of operating cash flow.
- LOS 31.b Calculate and interpret free cash flow to the firm, free cash flow to equity, and cash flow performance and coverage ratios.
Module 31.1
Analyzing Statements of Cash Flows II
This reading shows how an analyst evaluates a statement of cash flows: the sources and uses of cash in each section, what CFO says about earnings quality, and the two formats of common-size cash flow statement. It then defines free cash flow to the firm and to equity and the cash flow performance and coverage ratios, all of which a candidate must be able to calculate.
LOS 31.a — Reading reported and common-size cash flow statements
What the statement of cash flows tells an analyst
The cash flow statement gives an analyst information for assessing a firm's liquidity, solvency and financial flexibility. It answers practical questions:
- Do ordinary operations produce enough cash to keep the business running?
- Can maturing debt be repaid from internally generated cash, or will new financing be needed?
- Could the firm absorb an unexpected obligation or seize a new opportunity?
The analysis starts by listing the sources and uses of cash in each of the three sections (operating, investing and financing) and asking whether the pattern fits the firm's stage in its life cycle.
| Stage | Typical pattern |
|---|---|
| Early growth | Operating cash flow often negative (cash tied up in receivables and inventory); gap funded by issuing debt or equity, which cannot continue indefinitely |
| Mature | Operating cash flow positive and larger than capital spending; surplus returned to lenders and shareholders |
Operating activities: sources of CFO
Sustainable operating cash flow comes from the firm's earnings-generating activities. A firm can also boost CFO temporarily by shrinking noncash working capital:
- collecting receivables faster or running down inventory (these cannot fall below zero), or
- paying suppliers more slowly.
Such cash is classified as operating cash flow. It is not a sustainable source of cash, because suppliers will eventually refuse to extend more credit if payment keeps slipping.
Earnings quality. A stable relationship between CFO and net income signals good earnings quality. For a mature firm whose working capital is not growing, CFO normally exceeds net income, because depreciation and amortization reduce net income without using cash . If net income persistently runs well ahead of CFO, the firm may be making aggressive or improper choices, such as recognizing revenue too early or deferring expenses. The variability of both net income and CFO is also an indicator of risk.
Investing and financing activities
- Rising capital expenditures usually indicate growth; cutting capex or selling long-lived assets frees cash now but may mean heavier outflows later when old assets must be replaced. Investing flows also include acquisitions and purchases/sales of securities.
- The financing section (cash flow from financing activities) shows whether cash is being raised by issuing debt or equity and whether cash is going to repay debt, repurchase shares or pay dividends. Borrowing to pay dividends or buy back stock deserves scrutiny.
Common-size cash flow statements
Two formats are used:
| Format | Denominator | Main use |
|---|---|---|
| Revenue-based | Every line item as a % of net revenue for the period | Spotting trends and forecasting: once revenue is forecast, revenue-linked cash flows can be projected |
| Inflow/outflow-based | Each cash inflow as a % of total cash inflows; each cash outflow as a % of total cash outflows | Seeing which sources dominate and where cash goes |
Neither format uses total assets, the net change in cash, or CFO as the denominator. CFO is itself a net figure that mixes inflows and outflows, so it cannot serve as a base for individual payments.
Example. Cumbria Home Goods reports revenue of $4,000, cash paid to suppliers of $2,200 and total cash outflows of $3,600. Payments to suppliers are of revenue in the revenue-based format and of total outflows in the inflow/outflow format.
If a revenue-based statement shows CFO falling as a % of revenue while the inventory line (a use of cash) grows, the firm is tying up cash in stock. This is consistent with growth, but the analyst should ask whether the build-up was intended.
LOS 31.b — Free cash flow and cash flow ratios
Free cash flow to the firm (FCFF)
Free cash flow is the cash left for discretionary use once the firm has paid for its capital expenditures. It is widely used in valuation, and the two most common measures are FCFF and FCFE.
Free cash flow to the firm (FCFF) is the cash available to all capital providers (debtholders and shareholders) after the firm pays its operating costs and taxes and makes its investments in fixed capital and working capital.
From net income:
From operating cash flow (because ):
Key concept
where = noncash charges (depreciation and amortization), = cash interest paid, = tax rate, = fixed capital investment = cash paid for new fixed assets less cash proceeds from fixed assets sold, and = working capital investment (an increase in receivables or inventory, or a decrease in payables, is a use of cash).
- After-tax interest is added back because interest is paid to debtholders, who are among the capital providers FCFF serves. If the tax rate is not given, it can be inferred as income tax expense ÷ income before tax.
- Fixed capital investment differs from CFI, which may also include purchases of securities or loans made.
- Under IFRS, if interest paid is classified in financing activities, CFO already excludes it, so no interest is added back. If dividends paid were classified in operating activities, they are added back to CFO with no tax adjustment, because dividends are not tax deductible.
Free cash flow to equity (FCFE)
Free cash flow to equity (FCFE) is the cash available to common shareholders after all obligations, including those to lenders:
Key concept
Net borrowing = debt issued − debt repaid (subtract it if repayments exceed new borrowing). If no borrowing information is given, net borrowing is zero.
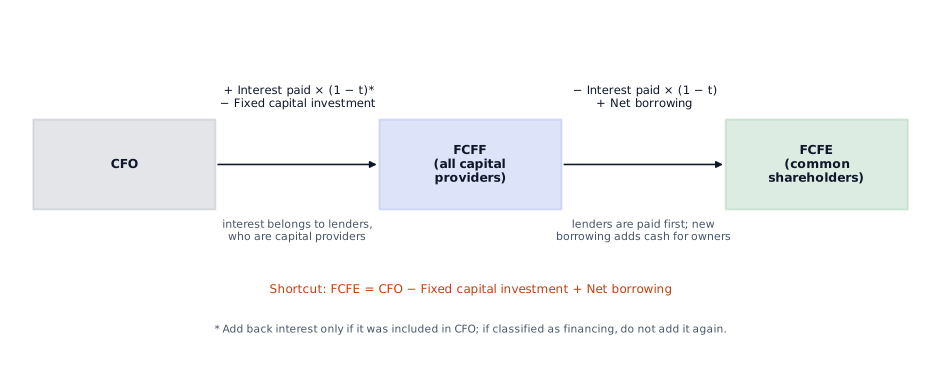
The chart shows how the three measures connect: start from CFO, give back the after-tax interest and pay for fixed capital to reach FCFF, then pay the lenders and add net borrowing to reach FCFE (see the figure below).
Example. A firm reports CFO of $920, cash interest paid of $80 (tax rate 25%), purchases of equipment of $310, proceeds from equipment sold of $40 and net new borrowing of $50.
- ; check:
Cash flow ratios
Cash flow ratios are compared over time for one firm or across firms, and fall into two groups.
Performance ratios (how well operations generate cash):
| Ratio | Formula |
|---|---|
| Cash flow-to-revenue ratio | CFO / net revenue |
| Cash return-on-assets ratio | CFO / average total assets |
| Cash return-on-equity ratio | CFO / average total equity |
| Cash-to-income ratio | CFO / operating income |
| Cash flow per share | (CFO − preferred dividends) / weighted average number of common shares |
Coverage ratios (ability to meet obligations and fund spending from CFO):
Key concept
| Ratio | Formula | Measures |
|---|---|---|
| Debt coverage ratio | CFO / total debt | Financial risk and leverage |
| Interest coverage ratio | (CFO + interest paid + taxes paid) / interest paid | Ability to meet interest obligations |
| Reinvestment ratio | CFO / cash paid for long-term assets | Ability to acquire long-term assets from operating cash |
| Debt payment ratio | CFO / cash long-term debt repayment | Ability to repay long-term debt from operating cash |
| Dividend payment ratio | CFO / dividends paid | Ability to pay dividends from operating cash |
| Investing and financing ratio | CFO / cash outflows from investing and financing activities | Ability to purchase assets, satisfy debts and pay dividends |
If interest paid is in financing activities (IFRS), no interest add-back is needed in the interest coverage ratio. If common dividends were placed in operating activities, they are added back to CFO for cash flow per share.
Example. CFO of $1,500 and $600 of cash spent on new long-term assets give a reinvestment ratio of : operating cash covers capital spending 2.5 times.
Common exam traps
- Recording the cash from paying suppliers more slowly as a financing inflow, or treating it as a lasting source of cash.
- The reinvestment ratio divides CFO by cash paid for long-term assets. Net CFI (which nets in asset sales and, for an IFRS firm, may include interest and dividends received) and total investing-plus-financing outflows (the investing and financing ratio) are wrong denominators.
- In FCFF from CFO, after-tax interest is added, never subtracted. In the example, subtracting it gives FCFF of 590 instead of 710.
- is net of proceeds from asset sales; forgetting the proceeds understates free cash flow. In the example, ignoring the proceeds of 40 gives FCFF of 670 instead of 710.
- From net income, working capital investment must be deducted: a rise in receivables and a fall in payables both reduce free cash flow.
- The cash-to-income ratio is a performance ratio; the debt payment ratio is a coverage ratio.
Exam shortcuts
- When FCFF is already known, FCFE follows directly as FCFF − Int × (1 − t) + net borrowing, without starting again from CFO.
Bottom line
- The statement of cash flows helps an analyst assess a firm's liquidity, solvency and financial flexibility.
- Cash generated by collecting receivables faster, running down inventory or paying suppliers more slowly is classified as operating cash flow, but it is not a sustainable source of cash.
- For a mature firm whose working capital is not growing, CFO normally exceeds net income; net income that persistently runs well ahead of CFO may point to aggressive or improper accounting choices.
- Common-size cash flow statements come in two formats: every line divided by net revenue, or inflows divided by total inflows and outflows divided by total outflows.
- FCFF equals CFO + Int × (1 − t) − FCInv, or NI + NCC + Int × (1 − t) − FCInv − WCInv, where FCInv is cash paid for fixed assets less cash proceeds from fixed assets sold.
- FCFE equals CFO − FCInv + net borrowing, where net borrowing is debt issued minus debt repaid.
- When interest paid is classified in financing activities under IFRS, CFO already excludes it, so no after-tax interest is added back in FCFF and no interest is added back in the interest coverage ratio.
- Performance ratios, such as cash flow-to-revenue and cash-to-income, measure how well operations generate cash, while coverage ratios, such as debt coverage and the reinvestment ratio (CFO / cash paid for long-term assets), measure the ability to meet obligations and fund spending from CFO.
Quick check
An analyst reviews three years of results for Pinecrest Media:
| Year | Net income | Cash flow from operations | Accounts receivable (year-end) |
|---|---|---|---|
| Year 1 | 42 | 45 | 60 |
| Year 2 | 51 | 38 | 84 |
| Year 3 | 63 | 31 | 117 |
Which conclusion is most appropriate based on these data?
Show answer and explanation
Correct answer: C
A stable relationship between net income and operating cash flow indicates good earnings quality. Here net income rises from 42 to 63 while CFO falls from 45 to 31, and receivables nearly double; earnings that increasingly exceed operating cash flow can signal aggressive or even improper accounting, such as recognizing revenue too early or delaying the recognition of expenses. The build-up in receivables points to revenue being booked well ahead of cash collection.
Net income minus CFO: Year 1 ; Year 2 ; Year 3 .
Receivables grow from 60 to 117 (+95%) while net income grows 50%, so revenue is being booked faster than it is collected.
Why the other options are wrong
- A. Steady growth in reported income says little about quality when operating cash flow is moving the opposite way; the diverging trend is the warning sign.
- B. Growing firms often have operating cash flow below net income because working capital expands, so the direction of the statement is wrong. A persistent, widening gap also calls for investigation.
Key takeaway Compare net income with CFO over several years: a persistent, widening excess of earnings over CFO is a red flag for earnings quality.
Practice Questions
Amara Osei is valuing Kestrel Logistics, which reports under US GAAP (interest paid is included in operating activities). She collects the following data:
| Item | Amount ($) |
|---|---|
| Net cash provided by operating activities | 4,600 |
| Fixed capital investment (net) | 950 |
| Cash interest paid | 300 |
| Income before tax | 5,000 |
| Income tax expense | 1,250 |
| Net income | 3,750 |
Kestrel's free cash flow to the firm (FCFF) is closest to:
Show answer and explanation
Correct answer: A
FCFF starting from CFO adds back after-tax interest (because interest is a payment to debtholders, who are capital providers) and deducts fixed capital investment. The tax rate is inferred from the income statement.
Tax rate
Why the other options are wrong
- B. $3,425 subtracts the after-tax interest () instead of adding it back. Interest paid is available to debtholders and belongs in FCFF.
- C. $3,025 starts from net income () and omits noncash charges and working capital investment; with net income as the base those adjustments are required, which is why the CFO-based formula is used when CFO is given.
Key takeaway . If is not given, compute it as .
Vasquez Dental Supply reports under US GAAP, so interest paid and income taxes paid are both included in its cash flow from operating activities. For the latest year, CFO was $7,800, cash interest paid was $600, and cash income taxes paid were $1,500. Vasquez's (cash flow) interest coverage ratio is closest to:
Show answer and explanation
Correct answer: A
The cash flow interest coverage ratio measures the firm's ability to meet its interest obligations. Because CFO has already been reduced by interest and taxes paid, both are added back to obtain the cash available before those payments, which is then divided by interest paid.
Why the other options are wrong
- B. 14.0 adds back interest paid but not taxes paid: . Taxes paid must also be added back.
- C. 13.0 simply divides CFO by interest paid () without adding back the interest and taxes already deducted in CFO.
Key takeaway Interest coverage (cash basis) adds back both interest and taxes paid. If an IFRS firm reports interest paid in financing activities, no interest add-back is needed.
This reading has 14 questions in the full bank. Practice all of them.
Key Takeaways
- Compare net income with CFO over several years: a persistent, widening excess of earnings over CFO is a red flag for earnings quality.
- . If is not given, compute it as .
- Interest coverage (cash basis) adds back both interest and taxes paid. If an IFRS firm reports interest paid in financing activities, no interest add-back is needed.