Financial Statement Analysis · Reading 32
LIFO vs FIFO
CFA Level I · Financial Statement Analysis · Reading 32: Analysis of Inventories · about 43 min
What you'll learn
- LOS 32.a Describe measurement of inventory at the lower of cost and net realizable value (and lower of cost or market under US GAAP) and the effects of write-downs and reversals on financial statements and ratios.
- LOS 32.b Calculate and explain how inflation and deflation of inventory costs affect the financial statements and ratios of companies using FIFO, LIFO or weighted average cost, including LIFO liquidations.
- LOS 32.c Describe inventory presentation and disclosures and the issues analysts consider when examining inventory disclosures, inventory mix and inventory ratios.
Module 32.1
Inventory Measurement
This reading covers how inventory is measured on the balance sheet, how FIFO, LIFO and weighted average cost change the financial statements when prices rise or fall, and what inventory disclosures and ratios tell an analyst. The calculations to master are the inventory write-down, the LIFO-to-FIFO restatement and inventory turnover.
LOS 32.a — Lower of cost or net realizable value (and lower of cost or market)
Review: which costs go into inventory?
Before measuring inventory, separate capitalized costs from period expenses. Inventory cost includes the purchase price net of trade discounts and rebates, import duties, transport and handling needed to reach the present location and condition, direct labor, and fixed and variable production overhead. Normal waste is included in production cost. Expense abnormal waste; storage unless it is necessary during production; administrative overhead; and selling costs. Capitalizing a cost that should be expensed overstates inventory and current profit. When the goods are sold, their capitalized cost becomes cost of goods sold.
Which measurement rule applies?
| Framework / cost method | Balance-sheet measure | Later recovery in value |
|---|---|---|
| IFRS (FIFO, weighted average cost, specific identification; LIFO is not permitted) | Lower of cost or net realizable value | Write-up allowed, but only up to the amount previously written down (carrying value never exceeds original cost) |
| US GAAP, any method other than LIFO or the retail method (e.g., FIFO, weighted average cost) | Lower of cost or NRV | No write-up |
| US GAAP, LIFO or the retail method | Lower of cost or market | No write-up |
Key concept
Net realizable value (NRV) = estimated selling price − estimated selling costs (disposal costs) − estimated completion costs.
Lower of cost or market (US GAAP, LIFO and retail firms)
Market is normally replacement cost, constrained to a band:
Key concept
- Ceiling: NRV. If replacement cost is above NRV, market = NRV.
- Floor: NRV − normal profit margin. If replacement cost is below the floor, market = NRV − normal profit margin.
- In between, market = replacement cost.
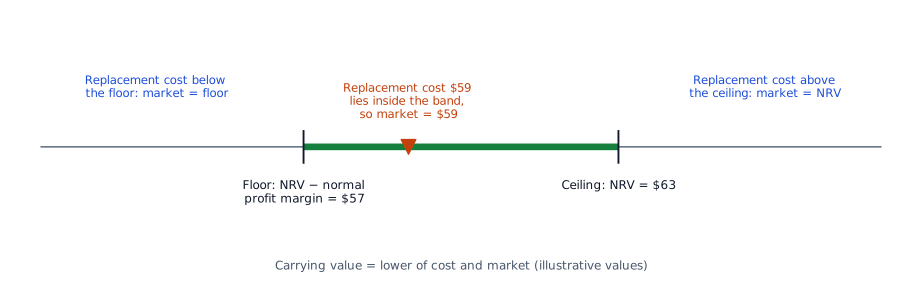
Then carrying value = lower of (original cost, market). The width of the band equals the normal profit margin, so the lowest possible "market" figure is selling price − selling (and completion) costs − normal profit margin.
Example
Per unit: original cost $64, expected selling price $70, selling costs $5, completion costs $2, replacement cost $59, normal profit margin $6.
- NRV . Lower of cost or NRV: , a write-down of $1 per unit.
- Market band: floor , ceiling . Replacement cost of 59 lies inside, so market = 59. Lower of cost or market: , a write-down of $5 per unit.
Next year NRV recovers to $67. An IFRS firm writes the unit back up to $64 (a $1 gain, capped by the original write-down); a US GAAP firm keeps it at its new cost basis and simply earns a higher margin when the unit is sold.
How the write-down is recorded
- The loss is recognized in the income statement, usually by increasing cost of goods sold (or as a separate line item if large). The inventory equation shows why: ending inventory = beginning inventory + purchases − COGS. Ending inventory falls with beginning inventory and purchases unchanged, so COGS must rise.
- Firms often use a valuation allowance, a contra-asset account similar to accumulated depreciation, so that original cost and carrying value are both visible.
- Under IFRS a write-up (reversal) is reported in profit or loss, as its own line or as a reduction of COGS.
- Under US GAAP, the written-down amount becomes the new cost basis.
- During inflation, LIFO firms are less likely to need write-downs, because their inventory carries older, lower costs.
- Producers and dealers of commodities (agricultural and forest products, mineral ores, precious metals) are an exception under both IFRS and US GAAP: they may report inventory at NRV even when it is above historical cost, with unrealized gains and losses in the income statement. The quoted price in an active market is used where one exists; otherwise recent market transactions are used.
Effects of a write-down on ratios (period of the write-down, loss charged to COGS)
| Item / ratio | Effect | Why |
|---|---|---|
| Current assets, total assets, equity | Decrease | Inventory falls; the loss reduces retained earnings |
| Current ratio | Decrease | Inventory is in current assets |
| Quick ratio | No effect | Inventory is excluded from the numerator (cash + marketable securities + receivables) and current liabilities are unchanged |
| Inventory turnover | Increase | Higher COGS over a lower inventory; days of inventory on hand and the cash conversion cycle fall |
| Total asset turnover | Increase | Revenue unchanged, total assets lower |
| Debt-to-assets, debt-to-equity | Increase | Debt unchanged, assets and equity lower |
| Gross, operating and net profit margins | Decrease | COGS higher |
| ROA, ROE | Decrease | The percentage drop in net income is typically larger than the drop in assets or equity |
In later periods the lower carrying amount flows through COGS, so COGS is lower and income higher. Combined with a smaller asset and equity base, ROA and ROE rise in those periods. Write-downs therefore distort comparisons of ratios across periods.
Common exam traps
- NRV deducts both selling (disposal) costs and completion costs from the selling price. In the example, deducting only the selling costs gives an NRV of $65, above the $64 cost, so the $1 write-down is missed.
- Lower of cost or market applies under US GAAP only to LIFO and retail-method firms; a US GAAP FIFO firm uses lower of cost or NRV.
- Replacement cost is not automatically "market": check the ceiling (NRV) and the floor (NRV − normal profit margin).
- IFRS reversals are limited to the original write-down, so carrying value can never exceed cost. US GAAP allows no reversal at all.
- Expecting an inventory write-down to lower the quick ratio.
Exam shortcuts
- Under lower of cost or market, market is the middle value of replacement cost, NRV and NRV minus the normal profit margin.
- An inventory write-down leaves the quick ratio unchanged, because the quick ratio excludes inventory, so an answer in which the quick ratio moves can be ruled out.
Bottom line
- IFRS firms, and US GAAP firms not using LIFO or the retail method, measure inventory at the lower of cost or NRV; US GAAP LIFO and retail-method firms use the lower of cost or market.
- NRV is the estimated selling price minus selling costs and completion costs.
- Market is replacement cost, but not above NRV and not below NRV minus the normal profit margin.
- IFRS allows a write-up only up to the amount previously written down; US GAAP allows no reversal.
- A write-down raises COGS, lowers the current ratio, margins, ROA and ROE, raises inventory turnover and leaves the quick ratio unchanged.
Quick check
Brenvale Creamery makes aged cheese. Its costs for the year are shown below.
| Cost | Amount |
|---|---|
| Milk and other direct materials | 410,000 |
| Direct labor | 185,000 |
| Fixed production overhead | 260,000 |
| Storage of cheese wheels during the aging stage of production | 38,000 |
| Normal spoilage during production | 6,200 |
| Spoilage caused by a refrigeration breakdown (abnormal) | 29,000 |
| Storage of packaged cheese awaiting delivery to customers | 17,500 |
The cost that Brenvale should include in inventory is closest to:
Show answer and explanation
Correct answer: C
Inventory cost includes the costs of purchase and conversion needed to bring the goods to their present location and condition: materials, direct labor, production overhead, normal spoilage and storage that is a necessary part of production, such as aging. Abnormal waste and storage of finished goods waiting for delivery are expensed as incurred.
Expensed: abnormal spoilage $29,000 and storage of packaged cheese $17,500.
Why the other options are wrong
- A. $928,200 also capitalizes the $29,000 of abnormal spoilage from the refrigeration breakdown, . Abnormal waste is expensed when it occurs.
- B. $916,700 also capitalizes the $17,500 of storage after production, . Storage is part of inventory cost only when it is required in the production process.
Key takeaway Put purchase and conversion costs, normal waste and production-related storage into inventory; expense abnormal waste, post-production storage, administrative overhead and selling costs.
Module 32.2
Inflation Impact on FIFO and LIFO
LOS 32.b — How inflation and deflation affect FIFO, LIFO and weighted average cost
Review: the three cost flow assumptions
| Method | Costs assigned to COGS | Costs left in ending inventory | Permitted |
|---|---|---|---|
| FIFO (first-in, first-out) | Oldest costs | Most recent costs | IFRS and US GAAP |
| LIFO (last-in, first-out) | Most recent costs | Oldest costs | US GAAP only (prohibited under IFRS) |
| Weighted average cost | Average cost of goods available for sale | Average cost | IFRS and US GAAP |
The methods differ in which costs are assigned to units sold and to units kept. The physical flow of goods does not have to match.
Example (periodic system)
Beginning inventory 100 units at $10; purchases of 200 units at $12, then 200 units at $14. Sales: 350 units. Goods available: 500 units costing .
| Method | COGS | Ending inventory (150 units) |
|---|---|---|
| FIFO | ||
| LIFO | ||
| Weighted average |
Average cost . In every case COGS + ending inventory = 6,200. With rising costs, weighted average lies between FIFO and LIFO. The difference between FIFO and LIFO inventory () is the LIFO reserve.
A US GAAP firm that uses LIFO discloses its LIFO reserve, which lets an analyst restate its figures on a FIFO basis before comparing it with FIFO or IFRS peers:
Key concept
- FIFO inventory = LIFO inventory + LIFO reserve, at each balance sheet date.
- FIFO COGS = LIFO COGS − (ending LIFO reserve − beginning LIFO reserve).
- Recompute the ratios with the FIFO figures.
Example. A LIFO retailer reports COGS of $5,300, beginning inventory of $900 and ending inventory of $1,100, and its LIFO reserve rose from $300 to $420. FIFO COGS , and FIFO inventories are and . Inventory turnover falls from on the reported LIFO basis to on a FIFO basis.
Rising prices, stable or increasing quantities
| Item | FIFO vs. LIFO |
|---|---|
| Cost of goods sold | FIFO lower, LIFO higher |
| Ending inventory | FIFO higher, LIFO lower |
| Gross profit, operating profit, pretax and net income | FIFO higher |
| Income taxes | FIFO higher |
| Cash flow (after tax) | LIFO higher (lower taxes paid) |
| Working capital, current ratio | FIFO higher |
| Stockholders' equity (retained earnings), total assets | FIFO higher |
| Debt-to-equity, debt ratio | FIFO lower |
| Inventory turnover (COGS / average inventory) | LIFO higher (higher numerator, lower denominator); FIFO has higher days of inventory on hand |
Weighted average cost figures fall between FIFO and LIFO. When prices are falling, every effect reverses: LIFO then has lower COGS, higher gross profit and net income, higher inventory, higher working capital, higher taxes and lower cash flow than FIFO; FIFO gives the lowest income.
Stable prices. If purchase costs have not changed (and beginning inventory was bought at the same cost, or is zero), FIFO, LIFO and weighted average cost give identical COGS, ending inventory and gross profit.
Minimizing reported pretax income (and taxes) in inflation. A US GAAP firm uses LIFO. Under IFRS, where LIFO is prohibited, weighted average cost gives lower income than FIFO.
Which figure is "most useful"?
- Balance sheet: FIFO inventory best approximates current cost (economic value), because it contains the most recent purchase costs.
- Income statement: LIFO COGS best approximates current cost. It matches recent costs against current revenue, which gives a better measure of current income and future profitability.
- This holds whether prices are rising or falling.
LIFO liquidation
A LIFO liquidation occurs when a LIFO firm's inventory quantity declines, so units are drawn from older, lower-cost LIFO layers into COGS. In an inflationary environment this:
- lowers COGS and raises gross and operating profit margins and income taxes;
- produces profits that are not sustainable, because the firm cannot keep selling old layers without replenishing them;
- may be deliberate (management drawing down inventory to boost earnings) or involuntary (strikes, supplier shortages, lower expected orders).
Analysts look for a decrease in the LIFO reserve in the footnotes as a signal of a possible liquidation and adjust margins if its effect is material.
Example. Layers of 100 units at $8 and 100 units at $11; this year the firm buys 400 units at $15 and sells 450 units. LIFO COGS ; had it bought 450 units, COGS would have been . The liquidation adds to gross profit.
Worked example: restating a LIFO firm on a FIFO basis
A US GAAP retailer that uses LIFO reports revenue of $26,000, COGS of $18,600, beginning inventory of $3,100 and ending inventory of $3,500. Its LIFO reserve rose from $900 to $1,250 during the year.
Step 1. FIFO inventories: at the start of the year and at the end.
Step 2. FIFO COGS .
Step 3. Gross margin: on LIFO and on FIFO.
Step 4. Inventory turnover: on LIFO and on FIFO, so days of inventory on hand are 64.8 and 87.5.
Result. On a FIFO basis the retailer shows a higher gross margin and slower inventory turnover. Both differences match the rising-price pattern: LIFO COGS is higher and LIFO inventory is lower than under FIFO.
Common exam traps
- Higher cash flow under LIFO in inflation comes from lower taxes. Pretax cash costs are the same under every method.
- Every inflation result reverses when prices are falling.
- A LIFO firm can report a higher margin than a FIFO firm even with rising prices if it has a LIFO liquidation.
- LIFO is not available to IFRS reporters.
- Specific identification, which assigns each unit its own actual cost, can give values above or below the other methods, depending on which units are sold.
Exam shortcuts
- With rising prices, start from LIFO's higher COGS: lower income, lower taxes and higher after-tax cash flow follow, and every comparison reverses when prices fall.
- With prices moving in one direction, weighted average cost figures always lie between FIFO and LIFO.
Bottom line
- FIFO puts the oldest costs in COGS and the most recent in ending inventory, LIFO does the reverse, and IFRS prohibits LIFO.
- With rising prices and stable or increasing quantities, LIFO gives higher COGS, lower income and taxes and higher after-tax cash flow, while FIFO gives higher inventory, working capital and equity.
- FIFO inventory = LIFO inventory + LIFO reserve, and FIFO COGS = LIFO COGS − (ending − beginning LIFO reserve).
- FIFO inventory best approximates current cost on the balance sheet; LIFO COGS best approximates current cost on the income statement.
- A LIFO liquidation in inflation lowers COGS and raises margins and taxes, but the extra profit is not sustainable; a decrease in the LIFO reserve signals it.
Quick check
Tolworth Hardware Supply reports under US GAAP and uses the LIFO method. For the year just ended it reported cost of goods sold of $4,815,000. Its inventory footnote shows a LIFO reserve of $612,000 at the beginning of the year and $538,000 at the end. Purchase costs fell during the year, and inventory quantities were unchanged. An analyst restates Tolworth's results to a FIFO basis to compare it with a peer that reports under IFRS. Tolworth's cost of goods sold on a FIFO basis is closest to:
Show answer and explanation
Correct answer: A
FIFO cost of goods sold equals LIFO cost of goods sold minus the change in the LIFO reserve over the year. The reserve fell by $74,000, so the change is negative and FIFO COGS is higher than LIFO COGS. That fits falling purchase costs: FIFO charges the older, higher costs to COGS, while LIFO charges the newest, lower costs. Inventory quantities did not change, so no old LIFO layers were drawn down: the fall in the reserve reflects lower purchase costs, not a LIFO liquidation. The restatement formula would be the same in either case.
Change in the LIFO reserve .
Check with the inventory equation, COGS = beginning inventory + purchases − ending inventory. Purchases are the same under both methods. FIFO inventory exceeds LIFO inventory by $612,000 at the start of the year and by $538,000 at the end, so FIFO COGS exceeds LIFO COGS by .
Why the other options are wrong
- B. $4,741,000 subtracts $74,000 from LIFO COGS, as if the reserve had risen. The reserve fell, so the change is negative and subtracting it raises COGS.
- C. $4,277,000 subtracts the whole ending LIFO reserve of $538,000. The ending reserve is the cumulative difference between FIFO and LIFO inventory and is the balance sheet adjustment. Only the change in the reserve during the year passes through COGS.
Key takeaway and . A falling reserve makes FIFO COGS higher than LIFO COGS.
Module 32.3
Presentation and Disclosure
LOS 32.c — Inventory presentation, disclosures and what analysts look for
Required disclosures (broadly the same under IFRS and US GAAP)
Inventory disclosures, mostly in the footnotes, help the analyst judge how well inventory is managed and adjust the statements so the firm can be compared with its peers.
- The cost flow method used (FIFO, LIFO, weighted average cost, etc.), so the analyst does not need to infer it.
- Total carrying value of inventory and carrying value by classification (raw materials, work in progress, finished goods) where appropriate.
- Carrying value of inventories reported at fair value less selling costs.
- The amount of inventory cost expensed in the period (COGS).
- The amount of inventory write-downs (valuation allowances) during the period.
- Reversals of write-downs during the period, with a discussion of the circumstances that led to the reversal. Only IFRS firms report this item, since reversals are prohibited under US GAAP.
- Carrying value of inventories pledged as collateral for liabilities. This is a disclosure only: the inventory stays in current assets and is not offset against the debt.
Reading the inventory mix
Merchandisers (retailers, wholesalers) report a single inventory line. Manufacturers report raw materials, work in progress and finished goods, and the mix can signal future demand:
| Pattern | Likely signal |
|---|---|
| Raw materials and/or work in progress rising | Management expects higher demand, so higher future revenue and earnings |
| Finished goods rising while raw materials and work in progress fall | Weakening demand; possible future write-downs |
| Finished goods growing faster than sales | Declining demand, excess or obsolete inventory; lower future earnings when written down; extra storage, insurance and tax costs and idle cash |
Analysts corroborate these signals with management's discussion and analysis, industry data and trade publications, other parts of the annual report, communication with management, and peer companies' accounts.
Inventory ratios
Key concept
Example. COGS of 4,800 and average inventory of 600 give turnover of 8.0 and days.
| Observation | Possible interpretation |
|---|---|
| Turnover too low / DOH high or rising | Slow-moving or obsolete inventory; future write-downs |
| Turnover high with sales growth at or above the industry | Efficient inventory management |
| Turnover high with sales growth below the industry | Too little inventory and lost sales; also possible if write-downs have shrunk inventory |
Other checks: the gross profit margin (rising input costs squeeze margins), the valuation allowance as a share of finished goods cost (a rising share points to obsolescence), and liquidity. The current ratio includes inventory while the quick ratio excludes it, so a sharp inventory drop can lower the current ratio while the quick ratio improves. Inventory is one of the least liquid current assets, since turning it into cash takes roughly days of inventory on hand plus days of sales outstanding. For that reason some analysts prefer the quick ratio.
Common exam traps
- Looking for write-down reversals in a US GAAP firm's notes.
- Netting pledged inventory against the loan it secures, or moving it out of current assets.
- Reading a build-up of raw materials and work in progress as a sign of weak demand.
Bottom line
- Inventory disclosures include the cost flow method, carrying value by class, the cost expensed, write-downs, reversals (IFRS only) and inventory pledged as collateral.
- Rising raw materials and work in progress suggest management expects higher demand; finished goods growing faster than sales suggest weak demand or obsolete inventory.
- Inventory turnover = COGS ÷ average inventory, and days of inventory on hand equal 365 divided by that turnover.
- Low turnover points to slow-moving or obsolete inventory; high turnover with sales growth below the industry points to too little inventory.
Quick check
An analyst reviews the following data for Merrow Cycle Parts, whose industry peers have maintained steady inventory levels:
| Item | Year 1 | Year 2 |
|---|---|---|
| Cost of goods sold | 7,300 | 7,665 |
| Average inventory | 1,000 | 1,680 |
| Finished goods (year-end) | 610 | 975 |
| Sales growth | 4% | 3% |
Merrow's days of inventory on hand in Year 2, and the most likely interpretation, are:
Show answer and explanation
Correct answer: C
Days of inventory on hand equals 365 divided by inventory turnover (COGS / average inventory). DOH has risen from 50 to 80 days while sales growth has slowed and finished goods have grown far faster than sales. These are signs of slow-moving or obsolete inventory that could require write-downs and depress future earnings.
Year 1: turnover ; DOH days.
Year 2: turnover ; DOH days.
Finished goods grow versus sales growth of 3%.
Why the other options are wrong
- A. About 50 days is the Year 1 figure; in Year 2 turnover fell to about 4.56, so DOH rose to about 80 days. A rise in DOH is not a sign of greater efficiency.
- B. The DOH figure is right, but a higher DOH (lower turnover) means inventory is sitting longer. Together with finished goods outpacing sales, this points to weaker inventory management.
Key takeaway Low turnover or rising DOH, together with finished goods outpacing sales, points to obsolescence and future write-downs.
Practice Questions
Three companies each report that the net realizable value of their inventory is now above its original cost. Which company is most likely permitted to carry that inventory on its balance sheet at an amount above historical cost?
Show answer and explanation
Correct answer: B
Producers and dealers of commodities, such as agricultural and forest products, mineral ores and precious metals, may report inventory at net realizable value even when it exceeds historical cost. The exception applies under both IFRS and US GAAP. Gains and losses from changing market prices are recognized in the income statement, and the quoted price is used when an active market exists.
Why the other options are wrong
- A. Under US GAAP, inventory is carried at the lower of cost and net realizable value (lower of cost or market for LIFO and the retail method), so a rise in value above cost is not recognized. The commodity exception does not extend to an electronics retailer.
- C. Under IFRS, a write-down is reversed when net realizable value recovers, but the reversal is limited to the amount of the original write-down. The carrying amount can return to cost but cannot exceed it.
Key takeaway Inventory above historical cost is allowed for commodity producers and dealers (agricultural and forest products, minerals, precious metals) under both IFRS and US GAAP, with value changes in the income statement. A write-down reversal restores cost at most.
An analyst suspects that Cordell Hardware, a LIFO user facing rising purchase costs, drew down old inventory layers this year to lift its reported profit. The most reliable evidence of such a LIFO liquidation is a:
Show answer and explanation
Correct answer: A
In a LIFO liquidation, units from older, cheaper layers pass into cost of goods sold. The gap between FIFO and LIFO inventory, the LIFO reserve, then shrinks. A decrease in the reserve disclosed in the footnotes is therefore the direct signal, and the analyst should adjust margins if its effect is material.
Why the other options are wrong
- B. A liquidation does raise the gross margin, but margins also rise for many other reasons, such as higher selling prices or lower input costs, so a higher margin alone does not identify a liquidation.
- C. Inventory can fall relative to sales for other reasons, such as better inventory management, and under FIFO or weighted average cost no LIFO layers exist to liquidate. The footnote reserve is the specific test.
Key takeaway Look for a fall in the LIFO reserve in the footnotes to spot a LIFO liquidation; the profit boost it gives is not sustainable.
This reading has 44 questions in the full bank. Practice all of them.
Key Takeaways
- Put purchase and conversion costs, normal waste and production-related storage into inventory; expense abnormal waste, post-production storage, administrative overhead and selling costs.
- Inventory above historical cost is allowed for commodity producers and dealers (agricultural and forest products, minerals, precious metals) under both IFRS and US GAAP, with value changes in the income statement. A write-down reversal restores cost at most.
- and . A falling reserve makes FIFO COGS higher than LIFO COGS.
- Look for a fall in the LIFO reserve in the footnotes to spot a LIFO liquidation; the profit boost it gives is not sustainable.
- Low turnover or rising DOH, together with finished goods outpacing sales, points to obsolescence and future write-downs.